The PCE Data Release and its Implications
Cooling Goods Inflation, Persistent Core Services Inflation Present a Mixed Picture
The Bureau of Economic Analysis (BEA) released its latest Personal Consumption Expenditures (PCE) data this morning. This report provides essential insights into the health of the US economy by measuring consumer spending and inflation.
Key Takeaways from the PCE Data Release
In line with forecast: The PCE data largely came in line with expectations, with the core PCE (excluding food and energy) showing a month-over-month increase of 0.3% and a year-over-year increase of 4.6%. The headline PCE index rose by 4.2% compared to the expected 4.1% and remained unchanged month-over-month at 0.1%.
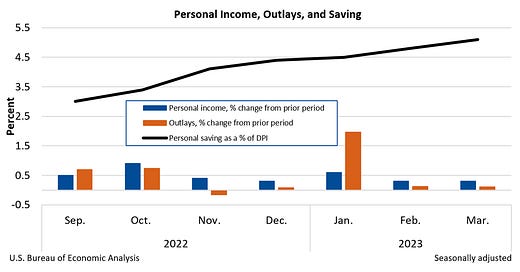
Personal income and disposable personal income grew: Personal income increased by $67.9 billion (0.3%) in March, while disposable personal income (DPI) rose by $71.7 billion (0.4%). The increase in personal income was mainly due to increases in compensation, personal income receipts on assets, and rental income.
Personal consumption expenditures increased marginally: Personal consumption expenditures (PCE) increased by $8.2 billion (less than 0.1%) in March. The increase in PCE was driven by a $44.9 billion increase in spending on services, which was partially offset by a $36.7 billion decrease in spending on goods. The largest contributors to the increase in services spending were housing and utilities and healthcare services.
Personal saving rate: The personal saving rate was 5.1% in March, with personal saving amounting to $1.00 trillion.
Prices: The PCE price index increased by 0.1% month-over-month in March. Excluding food and energy, the PCE price index increased by 0.3%. Year-over-year, the PCE price index increased by 4.2%, with goods prices increasing by 1.6% and services prices increasing by 5.5%.
Services inflation slows: PCE showed that services rose 0.2% month-over-month in cost, which would be an annualized rate of 4.8%. The prior month’s services reading was 0.4%. Core services showed an increase of 0.3% vs the prior month’s reading of 0.3%.
Goods prices drop marginally: The data also saw goods prices drop 0.2% month-over-month, led by non-durable goods, which dropped 0.3%. Durable goods dropped 0.1%. The prior goods reading was a gain of 0.1% month-over-month.
Implications for the Economy
The PCE data release offers several important insights.
Inflation trends: The PCE data reflects the ongoing inflationary pressures in the economy. The continued upward pressure in core services inflation is a something that the Federal Reserve is likely to be monitoring closely for its upcoming policy decision on May 3rd, where Fed Funds Futures price an 90% chance of a 25 bps hike. Meanwhile, goods inflation is continuing to show encouraging signs of slowing
Consumer spending patterns: The PCE report highlights the changing consumer spending patterns in the economy, with increased spending on services and decreased spending on goods. This information can help investors identify potential investment opportunities in sectors that are benefiting from shifting consumer preferences.
Income and saving trends: The increase in personal income and disposable personal income indicates a healthy labor market and the potential for increased consumer spending in the future. The personal saving rate also offers insights into the financial health of households, which can impact future consumption and investment decisions. Personal income rose 0.3% month-over-month, matching the last month’s gains with the savings rate hitting 5.1%.
Closing Thoughts
Today's PCE data release showed some encouraging signs in goods prices and the personal savings rate. Though core services inflation remains resilient, at 0.3% per month. Which would be annualized to a rate of 3.6% per year. A number that would give the Fed some discomfort.
We continue to believe that the Fed will hike at least once, possibly twice more, by 25 bps at each potential hike and are keeping our eye on April’s CPI data which may come in meaningfully higher month-over-month than the data we saw in March due to the rise in energy and other commodity prices, as well as core services inflation remaining persistently elevated.


