PPI Report Shows Cooler Inflation
But Energy and Other Commodity Prices Rising Could Undermine Progress
The March Producer Price Index (PPI) report released today by the U.S. Bureau of Labor Statistics showed a cooler-than-expected inflationary trend at the headline level, with some core month-over-month deceleration as well. Core remained firmly higher year-over-year. Here’s a breakout:
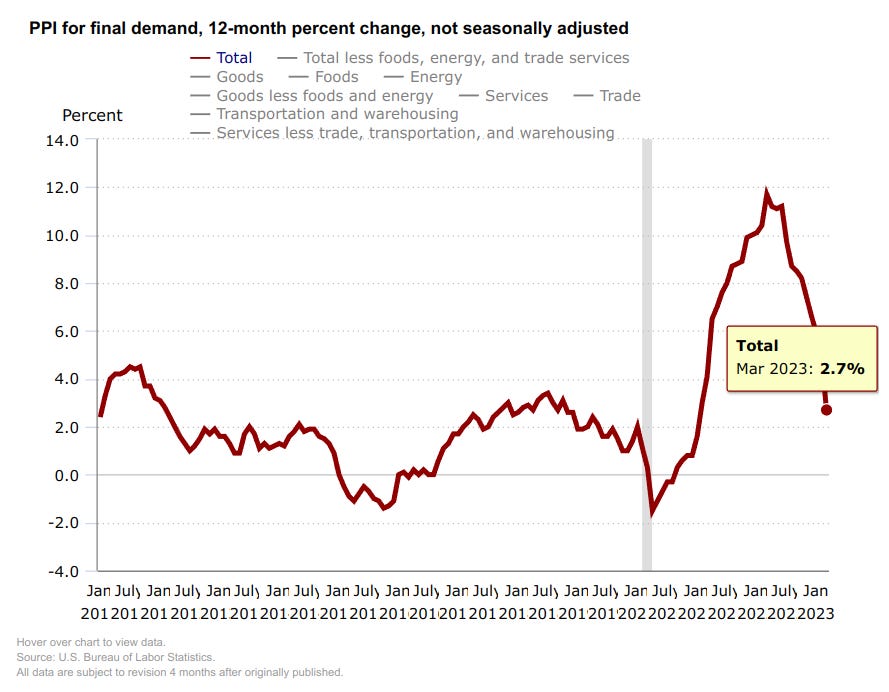
PPI y/y: 2.7% (expected 3%, last month 4.6%)
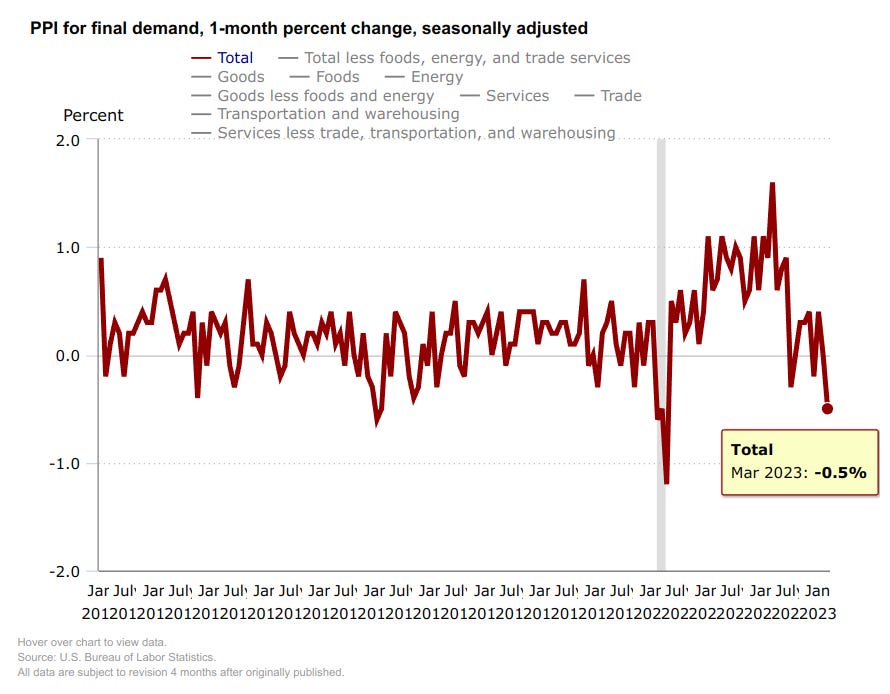
PPI m/m: -0.5% (expected 0%, last month 0.1%)
Core PPI y/y: 3.4% (expected 3.4%, last month 4.4%)
Core PPI m/m: -0.1% (expected 0.2%, last month 0%)
Why does PPI matter and what did we learn?
To understand the significance of these findings, it's important to know what the PPI represents. The PPI measures the average change in prices received by domestic producers for their output. It is a key indicator of inflation and is closely monitored by economists, policymakers, and investors.
According to the report, the PPI for final demand declined 0.5% in March, seasonally adjusted. This decline was mainly driven by a 1.0% decrease in prices for final demand goods and a 0.3% decrease in prices for final demand services. On an unadjusted basis, the index for final demand advanced 2.7% for the 12 months ended in March.
For newer investors, "final demand" refers to the demand for goods and services by consumers and businesses that will not be resold or used in the production of other goods and services. In this context, final demand goods and services are the products and services that are sold to end-users, such as households and businesses.
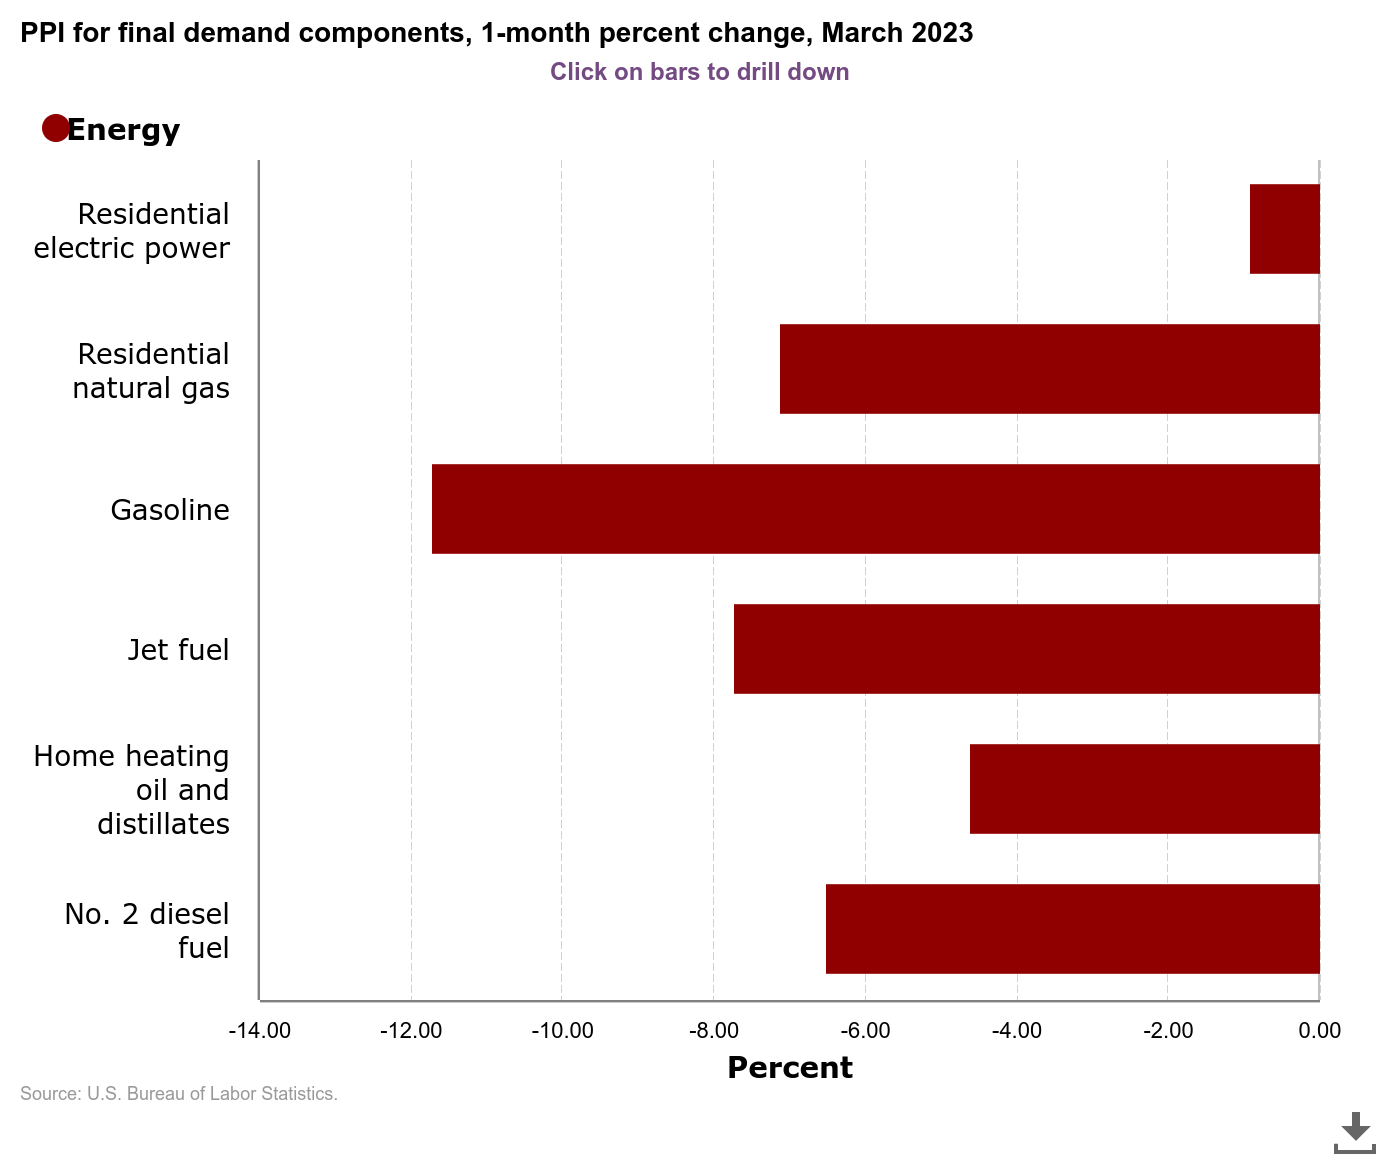
Energy showed weakness across the board
Energy as a component of goods final demand declined the most month-over-month, down 6.4%. The largest drop was in gasoline, which fell 11.7%. Followed by jet fuel, which fell 7.7% and third was residential natural gas, which fell 7.1%
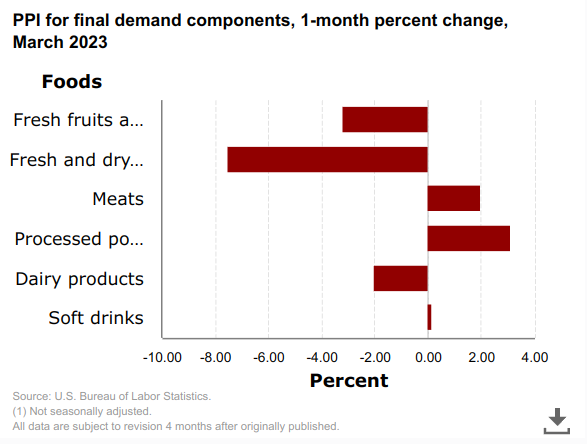
Foods provide a mixed picture
While the sub-index dropped 0.6%, processed poultry and meats rose 3.1% and 2% month-over-month respectively. Fresh and dry vegetables fell 7.5% and fresh fruits and melons fell 3.2%.
The report also showed that prices for final demand less foods, energy, and trade services edged up 0.1% in March, after rising 0.2% in February. For the 12 months ended in March. The index for final demand less foods, energy, and trade services increased 3.6%.
The exclusion of food, energy, and trade services in this measure helps provide a clearer picture of underlying inflation trends, as these components can be volatile and potentially distort the overall trend.
Transportation costs fell
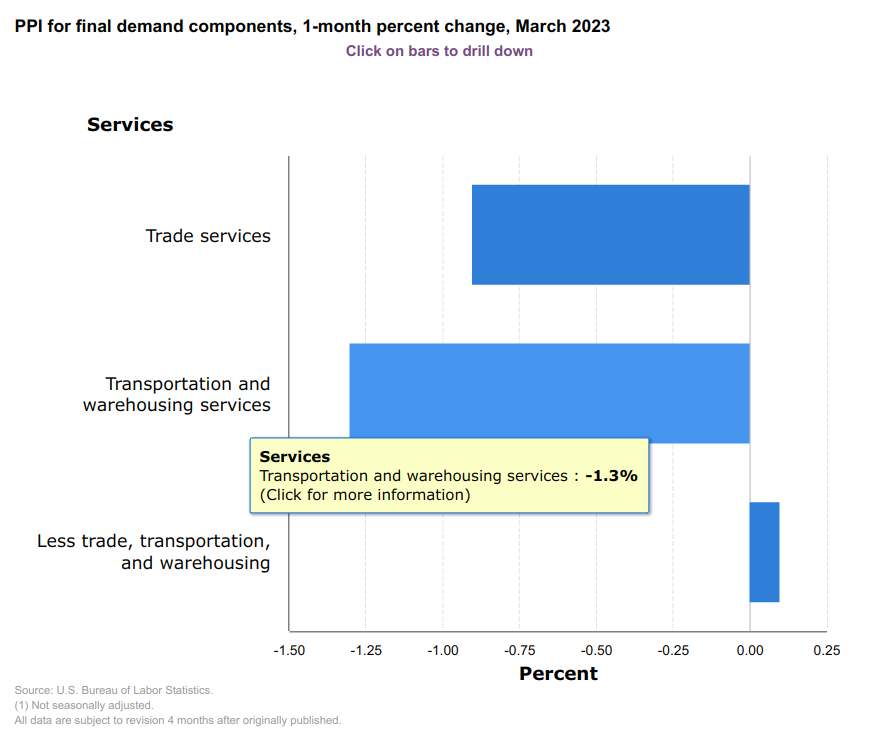
Transportation saw noteworthy weakness in pricing month-over-month, perhaps related in part to the decline in energy prices, but also likely driven to some degree by falling demand for services.
This would make sense as we’ve seen in the last ISM Manufacturing report that there was a drop in demand for new orders, backlog was clearing, therefore there would be less transportation activity related to that. We’ve also seen indications that retail spending is declining, particularly in real terms, which would suggest less need to restock inventories.
Trade ideas
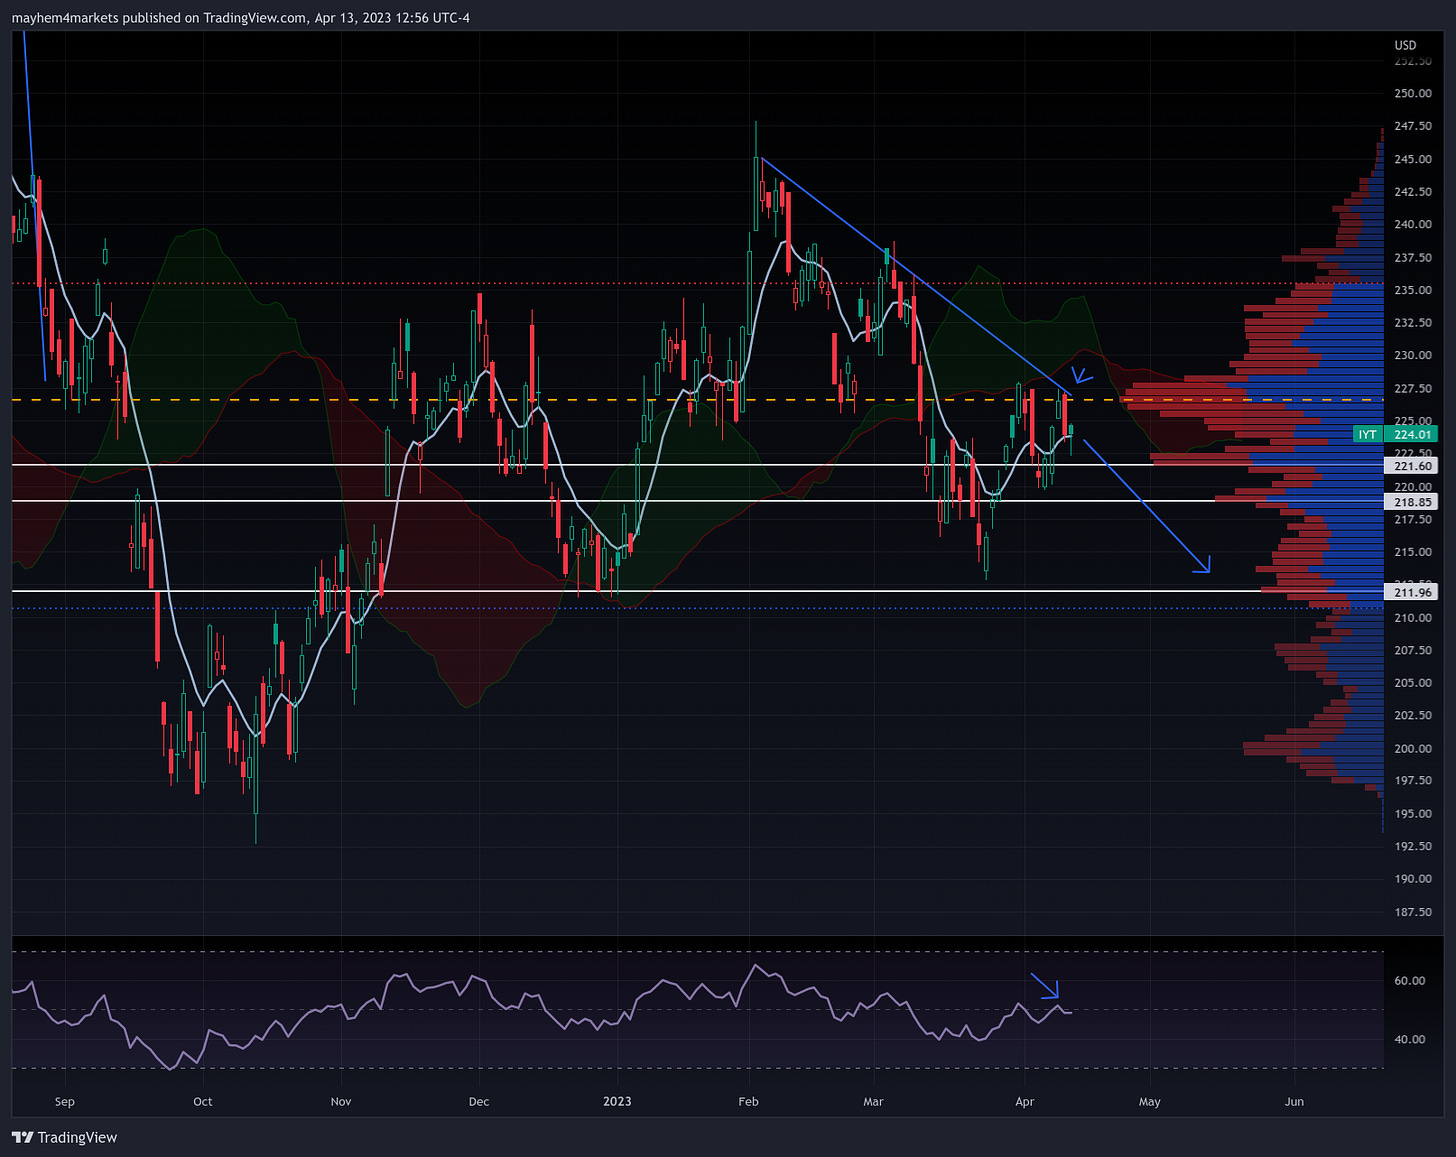
The transportation sector may weaken as a result of these developments, and that could lead to IYT being a decent fade here. With less need for transportation services we could see companies in this industry see a decline in revenue and earnings.
The chart has been one of lower highs and lower lows, playing out with some potential for continuation as RSI is below 50, and we’ve seen a recent rejection from the downward trendline. Price is also below the Ichimoku cloud, indicating a downtrend.
This trade is likely to be a play that takes several months to play out, so there’s certainly no need to rush into it if one is taking any position at all. The risk-off level for short positions would be a daily close above the point of control at 227.
Otherwise there are levels of potential support to watch for as noted in the chart above, with the ultimate price target being just below $212 should they all give way.
We’ll be writing more about this and related opportunities soon in more detail for our Premium members.
Final thoughts
The decline in the PPI is expected to help reduce pass-through inflation, which occurs when businesses pass on increased input costs to consumers in the form of higher prices for goods and services. Lower pass-through inflation is generally good news for consumers, as it means they may face less upward pressure on the prices of goods and services they purchase. This generally takes about two months to play out from PPI to CPI.
However, energy and other commodity prices have been firming up in April, which could undermine some of the improvements seen in the PPI. Higher energy and commodity prices can lead to increased production costs for businesses, potentially resulting in higher consumer prices down the line.
The latest PPI report indicates a cooler inflationary trend on the supply side, which may help reduce pass-through inflation. Nevertheless, the potential for rising energy and commodity prices in the near future could offset some of these improvements.
As a newer or mid-level investor, it's crucial to monitor commodity prices as well as these lagging economic indicators, as they can directly impact the broader market, sectors, industries, and individual investments.

