

Today’s PCE numbers were one of the most watched numbers because it may determine the course of whether the Fed will raise rates in June. While the Fed has been emphasizing that they are data dependent, this time’s data may actually make them change course.
The PCE inflation numbers came in higher than expected and this is quite possibly not what the Fed wants to see. In fact, the market is already pricing a higher probability of a rate hike, now that inflation seems to have re-accelerated.
The Numbers
Personal income increased 0.4% month-over-month in April (Briefing.com consensus 0.4%) following a 0.3% increase in March.
Personal spending increased 0.8% month-over-month (Briefing.com consensus 0.4%) following an upwardly revised 0.1% increase (from 0.0%) in March.
The PCE Price Index increased 0.4% month-over-month (Briefing.com consensus 0.3%) and was up 4.4% year-over-year versus 4.2% in March.
The core-PCE Price Index, which excludes food and energy, was up 0.4% (Briefing.com consensus 0.3%) and was up 4.7% versus 4.6% in March.
~ Briefing.com
Fed Rate Hike
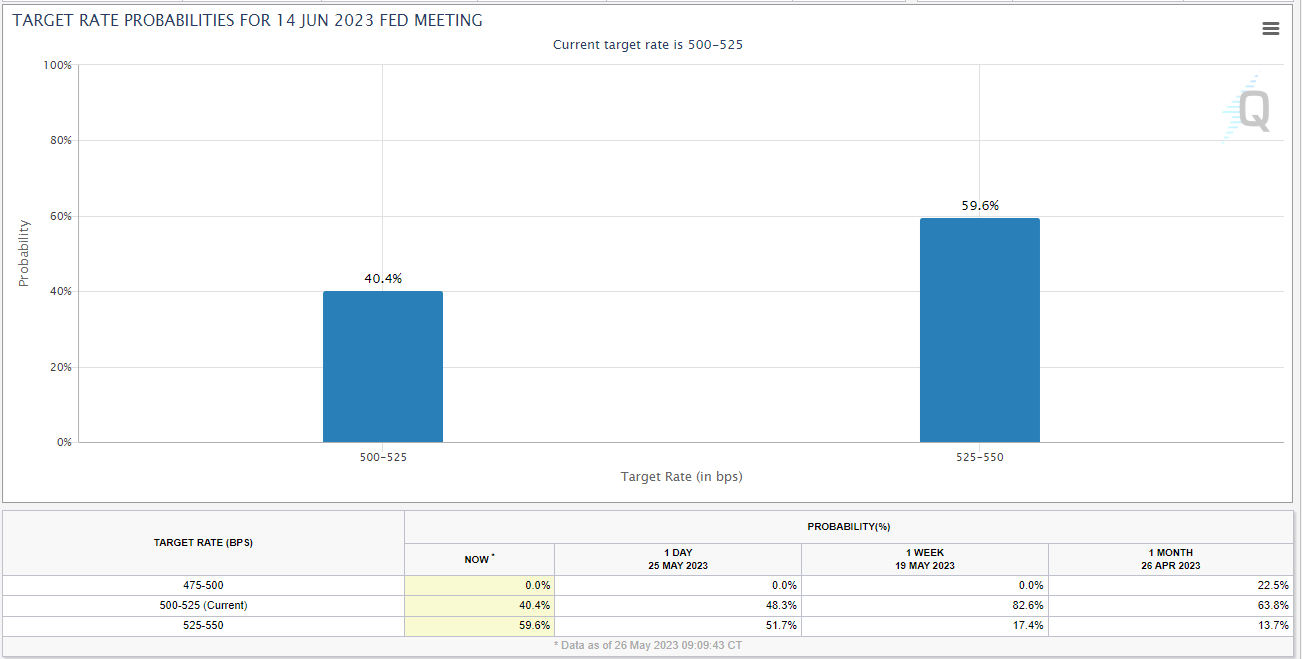
The market is now pricing in a 59.6% probability of a rate hike during the 14 June Fed meeting. One week ago, the probability was only at 17.4%.
The Market Reaction
The initial market reaction was negative but, now however, the market doesn’t seem to care. Getting closer to a debt ceiling deal seems to be on the agenda and the SPX is up 0.89% and the Nasdaq-100 is up 1.4%, as of this writing. It would seem the SPX is trying to recapture the 4200 mark again today.
It is of course, Friday, which means is options frenzy day and that may have something to do with it.
Let’s look at the details of the data…
Data Details
As usual, I sliced and diced the data to color code them and create charts.
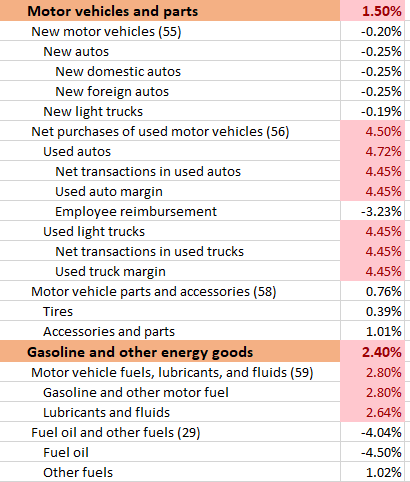
PCE - Percentage Change Data
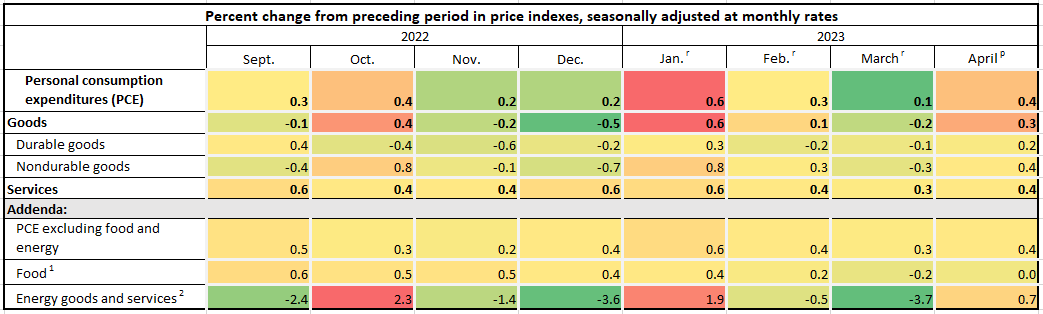
The color coding makes it very clear that we had a great March with numbers softening but the April inflation numbers have clearly accelerated across the board.
Looking at the broader items, Energy remains the largest percentage causing the increase in headline inflation.
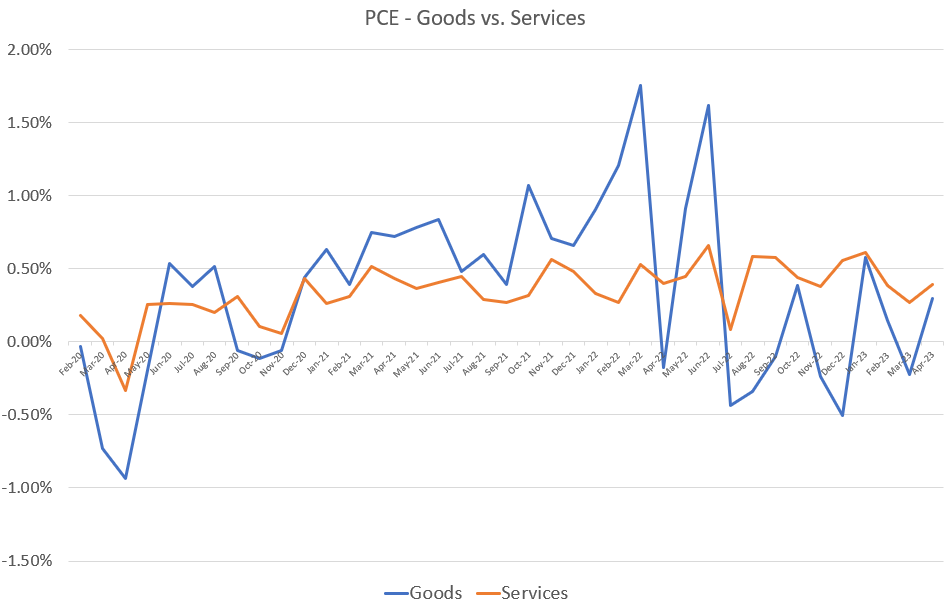
Goods vs. Services
Another interesting data point to consider is the Goods vs. Services. On a longer time horizon, we see that goods spending has declined considerably from the peaks in 2022 while services continued to steadily increase but, at a slower pace. ⤵
Zooming in however, we see that we got some welcome decreases in the Goods spending data for the last few months, albeit not very even changes.
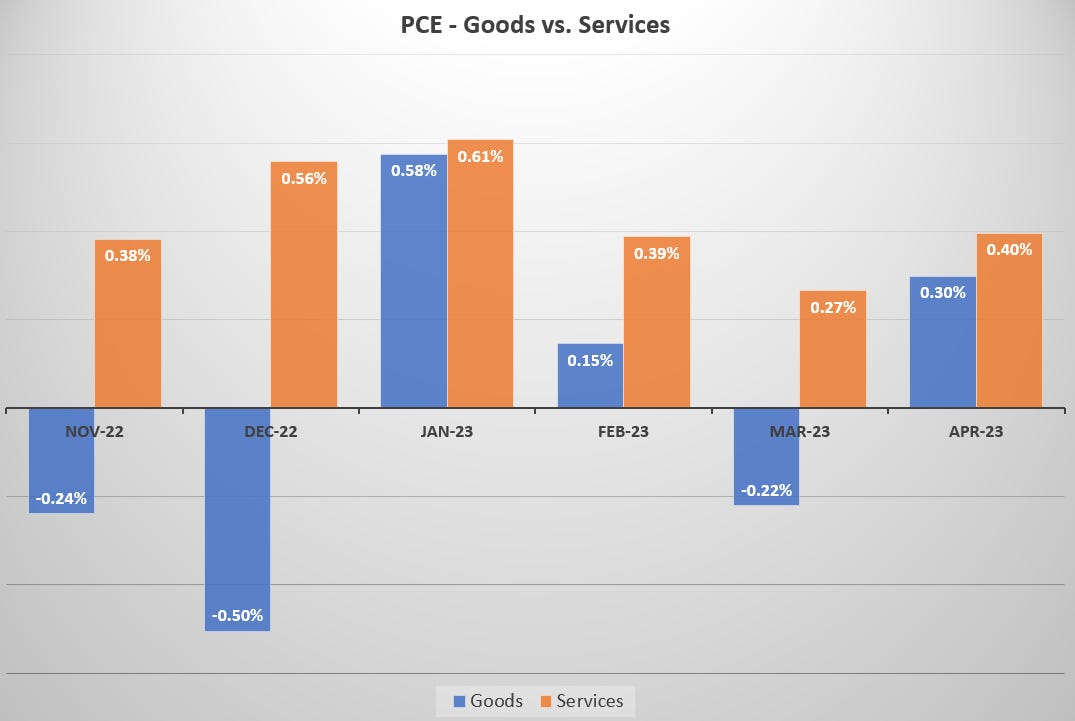
This month we see both goods and services have accelerated and at a higher pace that February or March.
What are the main drivers?
I looked at the entire spreadsheet and came up with this list of main drivers of acceleration.
Motor Vehicles & Energy - We saw this in the CPI data as well.
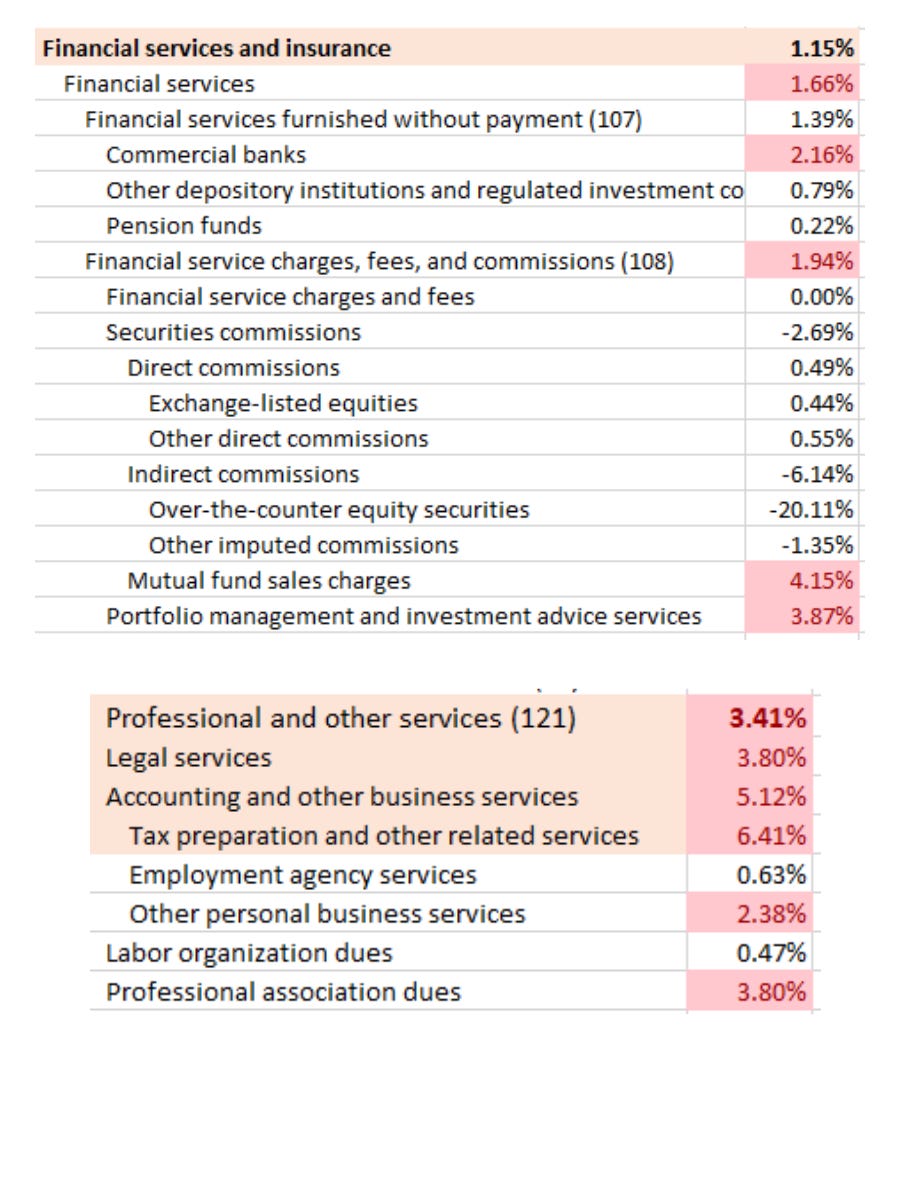
Financial Services and Professional Services
It is tax season and people are putting away more in money market funds.
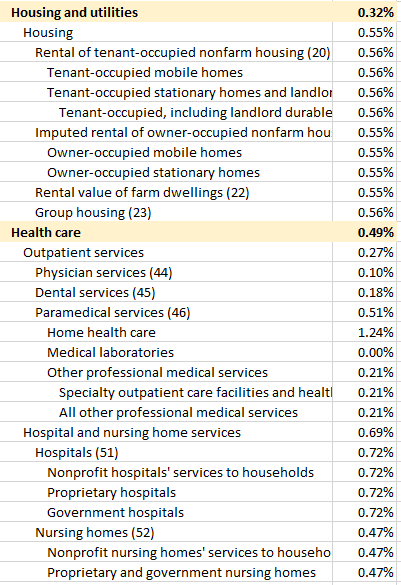
Finally, two more areas of interest are Housing and Healthcare. Both of which are still accelerating.
Closing Thoughts
We’ve certainly come a long way from the days of peak inflation and one data point doesn’t necessarily mean that inflation data will start to reverse course here.
It’s true that the CPI and PPI data measures are coming in better than expected and therefore, an acceleration in PCE numbers looks like a divergence here. Nevertheless, the data didn’t come in far above what was expected.
Whether the Fed sees this as a reason to hike again is based on two things in my opinion:
Whether they analyze and view this as the start of a reacceleration trend
Whether they see the Energy inflation as transitory (there’s the word again!)