


Cooler headline; Sticky core
Headline inflation cooled more than expected, while core inflation continues to remain sticky

We got the much anticipated CPI Inflation numbers for May and they were better than expected at the headline level, not so much at the core level.
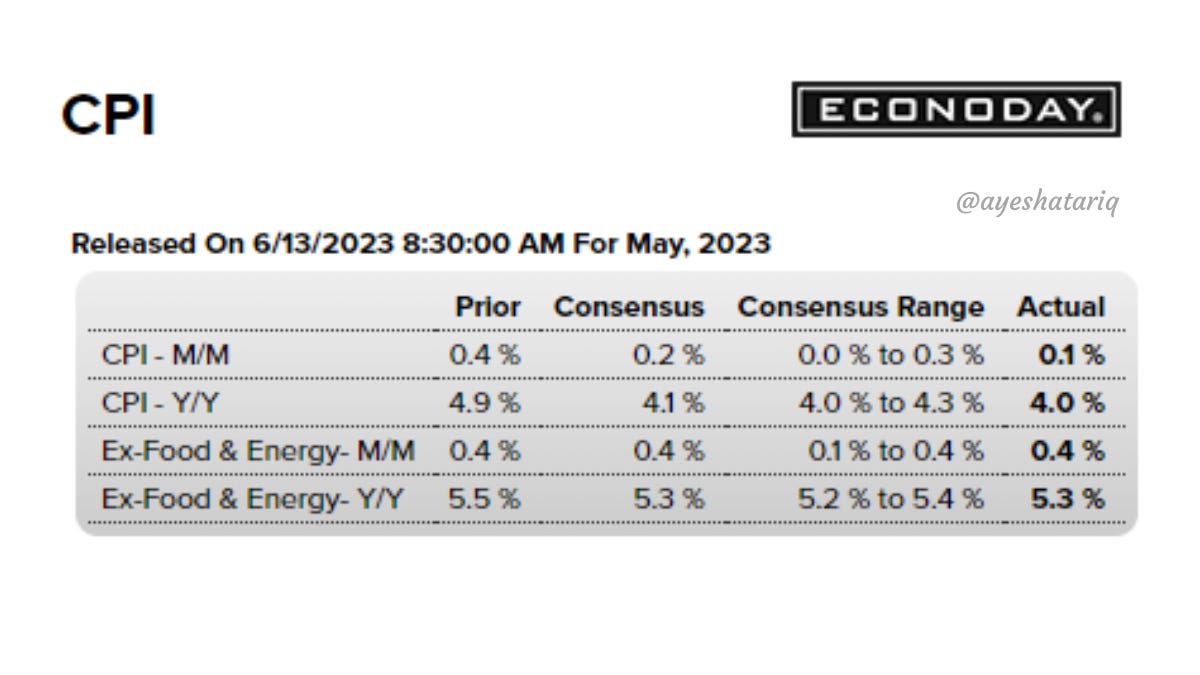
At first glance, core inflation, i.e. inflation ex-food and energy came out in line with median consensus expectations. The market is certainly seeing it as a win, as both the initial reaction from the futures market is up, up and away.

It’s no surprise that the market is celebrating because this reinforces the view that the Fed will pause rate hikes tomorrow.
The probability of no hike is now at 94.2%.

But, this may not mean that the Fed is done for good. We will know more on that tomorrow.
Read on as we take a look under the hood of the CPI numbers.
As always we start off with the heatmap that I created from the numbers presented by the BLS:

Let’s start off with the overall numbers and the yearly change in the last column. Everything other than Medical Care Commodities is green and has seen a decline. This is great news!
Monthly data for Headline Inflation:
Headline all items came in lower than expected at 0.1% MoM vs. the expected 0.2% MoM and previous 0.4% MoM.
Food inflation has started to rise again a little, with the rate of change increasing from last month. While overall, yearly inflation has come down, we’d definitely not like to see the monthly number increase.
Energy has had a significant decline of -3.6% MoM. An actual decline, even higher than what we saw in March. This is very good news. While the rate of change in the decline for Energy Services has slowed, we’re still seeing deflation which is good.
Monthly data for Core Inflation:
Core inflation came out in line with expectations at 0.4% MoM, with no change from the previous month either. Three items however, that we didn’t like are Used cars, Medical Care Commodities and Shelter.
Used Cars
Used Cars remained stable at 4.4% but you can see that this is still a high number historically. As we discussed last time, we saw the Manheim Used Vehicles Index go up during the beginning of the year and this number is likely following this path with a lag.
We saw increases in the index from December 2022 to March 2023, when it peaked and started coming down again. It’s likely these numbers continue to remain hot for another month or two. This was the second largest contributor to the MoM increase in core inflation.

Medical Care Commodities
This is mainly pharmaceuticals and medical equipment. We’ve discussed this before. With the Inflation Reduction Act (IRA), there will be a cap on price increases for pharmaceuticals so, we’re seeing the companies front run this and increase prices.
We do expect this to be resolved somewhat with the IRA coming into play.

On a year on year basis, we’re up 4.4% in this category and still increasing for now.

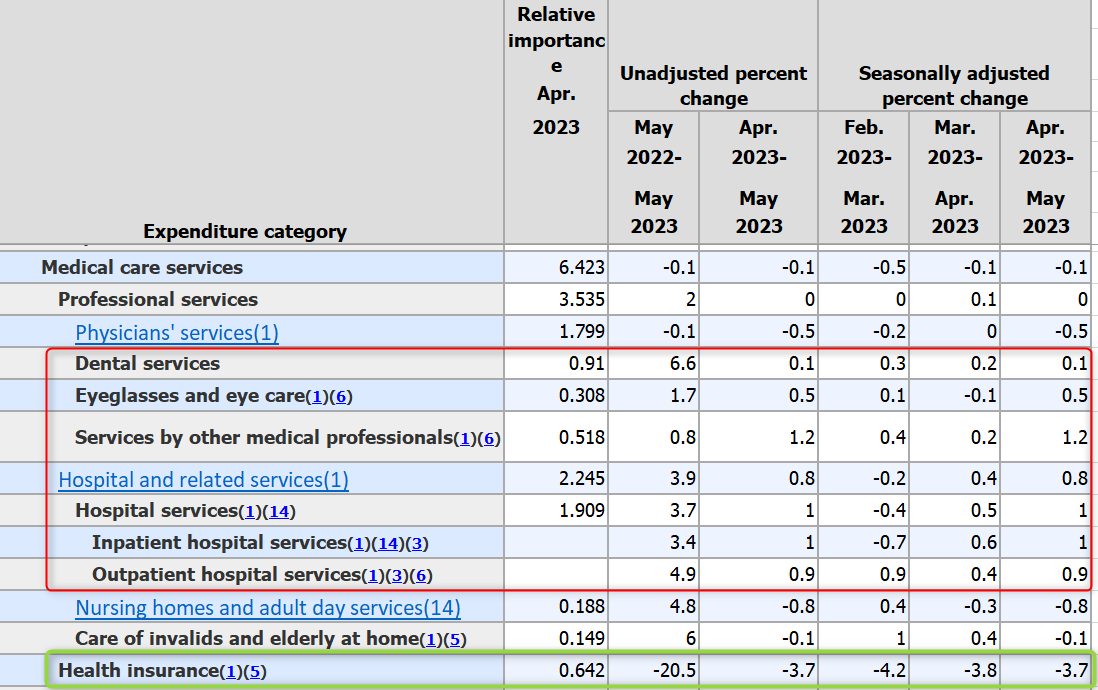
Medical Care Services
Medical Care Services is still declining overall mainly because of insurance adjustments but, hospital and dental services are still increasing. We see the labor numbers increasing here and wages as well. This will be a troubling issue for the Fed.
The insurance adjustment is something we will want to keep an eye on from October onwards because there may be a positive adjustment there, pulling up the numbers.
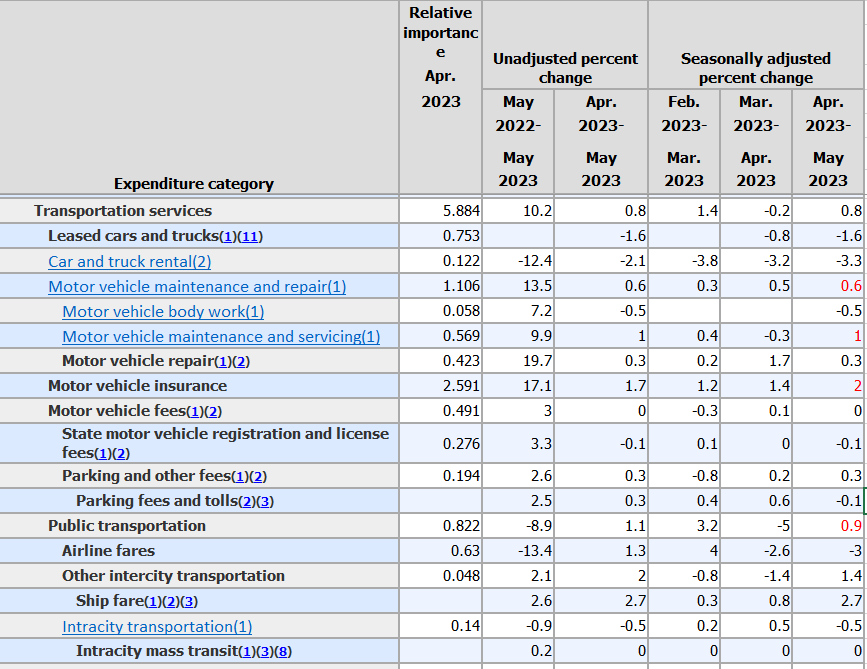
Transportation Services
Transportation services increased month-on-month from -0.2% to 0.8% driven by public transportation, vehicle repairs & maintenance and motor vehicle insurance.
Shelter Inflation
On a Month-on-Month basis, Shelter Inflation came in higher again. The rate of change increased from 0.4% in April to 0.6% in May. The good news is that this was driven primarily by lodging away from home, i.e., hotels and motels. With the pent-up demand, we’ve seen hotel prices increase and leisure activity take off. We do believe that this will drop remarkably after the summer and stay down.

However, rents are not moving. The rate of change remains stagnant and seeing a negative or declining number would be good here.

Shown above is my chart from previous calculation. The data suggested that we peak in August 2023. However, given the aggressive tightening cycle, we had hoped that Shelter Inflation would start to decline around May. On a Year-on-Year basis, we are seeing shelter inflation come down, which is good.

However, there’s discussion and anecdotal evidence that rents have started to increase again. There’s also the Zillow Rent Index that shows that even thought rents have declined on a yearly basis, they have started to gain traction again on a monthly basis.

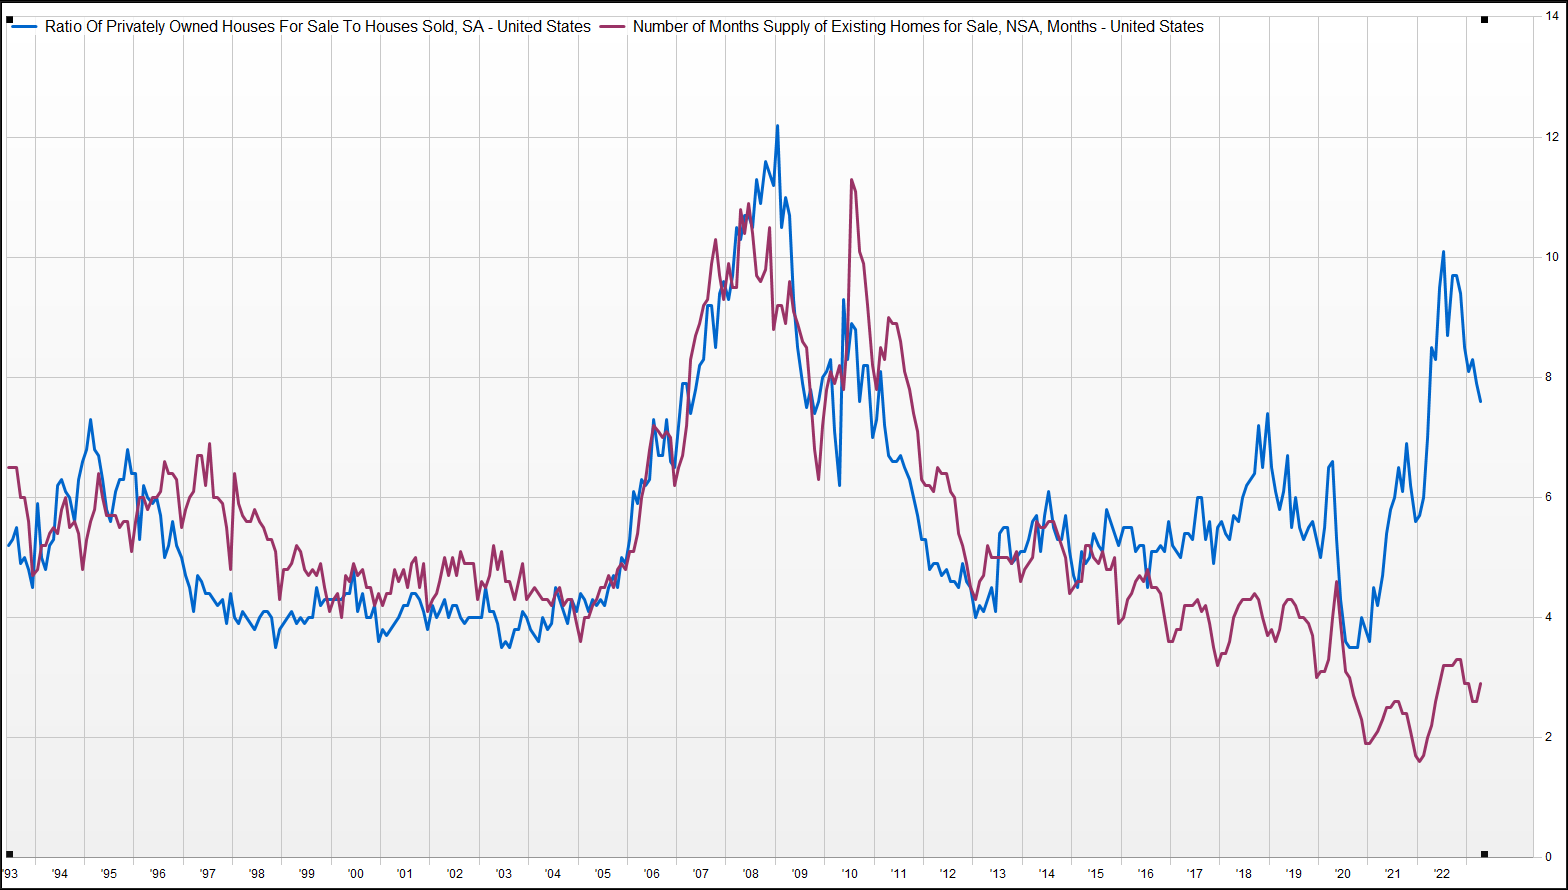
Finally, there is the tightness of supply in the residential market. Supply of new homes is declining and is below 7 months of supply. Supply of existing homes is below 3 months of supply.
Closing thoughts
We need to keep an eye on the core inflation numbers. While we may not see serious re-acceleration, we see that it continues to remain sticky and that’s not inline with what the Fed wants, nor is it what anyone wants for the economy. Rents in particular, would be something to track closely.