
The concentration inside the S&P of just five stocks being a sizable amount of the total index has risen again, now to 24.4%.

We can see why, as year-to-date performance has been strongly concentrated in a handful of these very large stocks, many of the same have very high weightings in the S&P 500, and even moreso in the NASDAQ 100.

Seen another way, the performance of the S&P 500 equal weighted index vs the market cap weighted index is rather poor this year. Falling significantly since January as the narrow rally powered the market.

Flows into megacap “MAGMA” stocks (Microsoft, Apple, Google, Meta, and Amazon) have been significant over the last year as we can see concentration on the rise in terms of positioning.

Market breadth is the worst we’ve seen since the Dot Com bubble, which is a bit ominous as poor breadth often leads to a leg down.

Meanwhile, smaller stocks have underperformed larger stocks since March by a rather large margin. Illustrating again the lack of broader upside participation in the market.
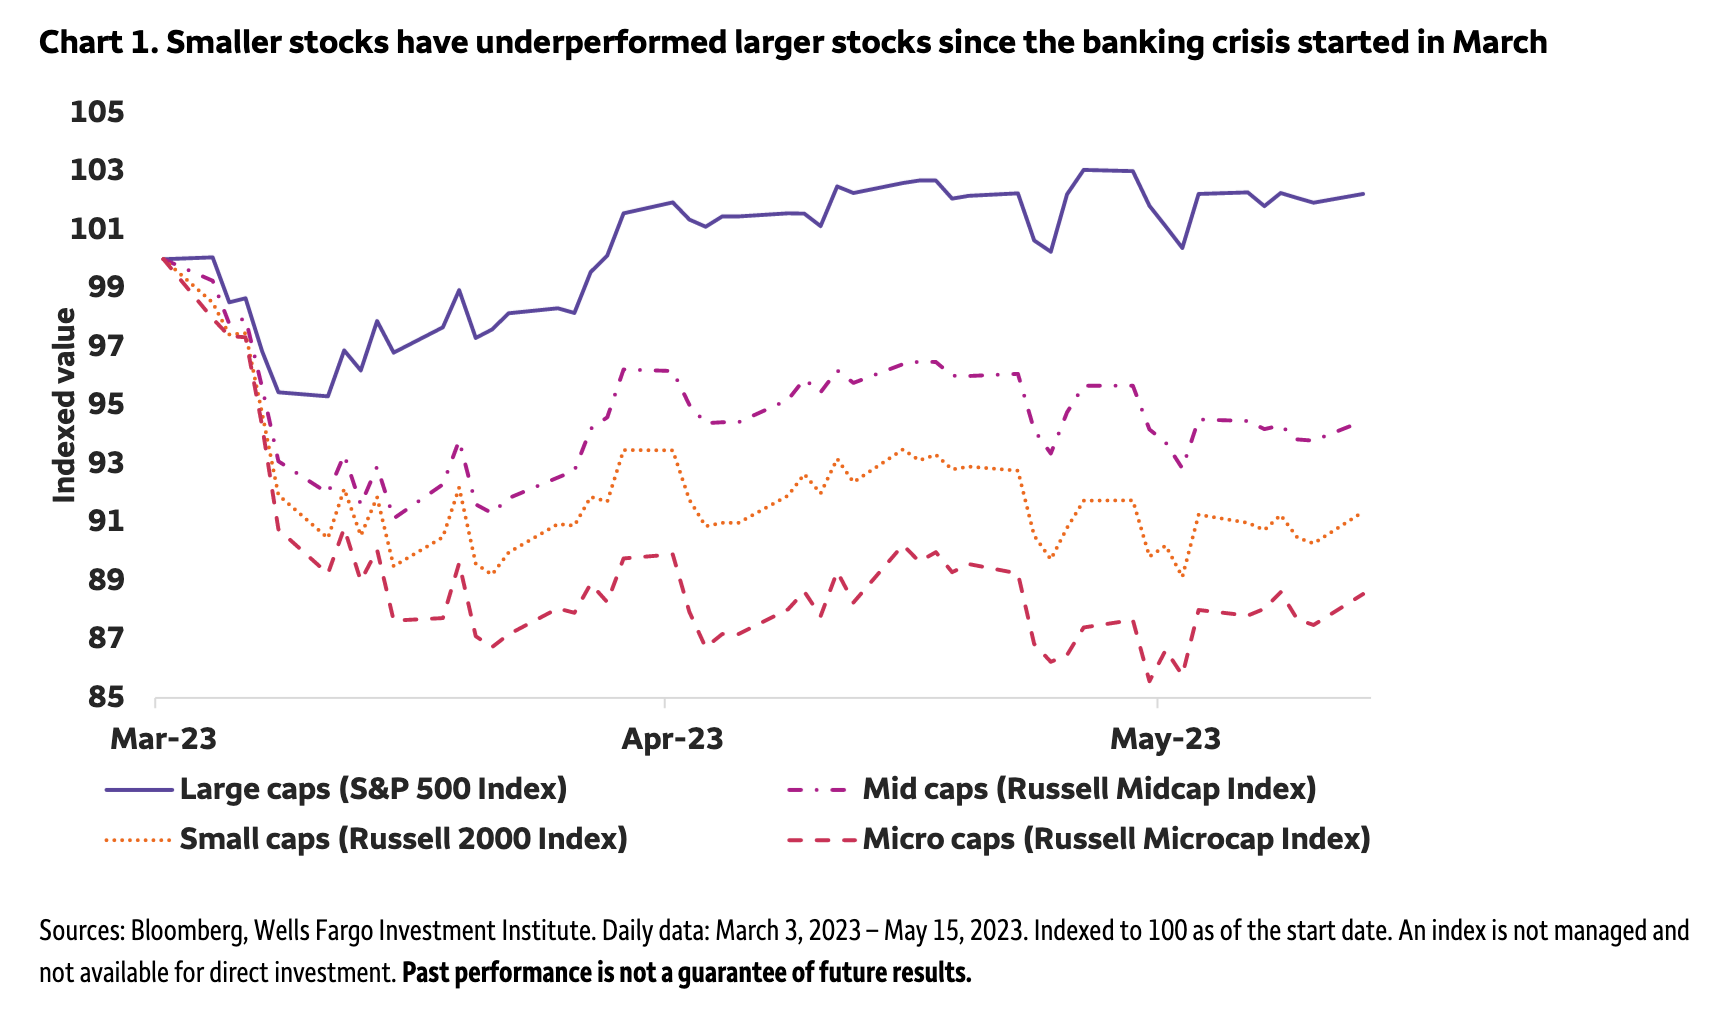
Another reason that small caps may be underperforming is that 42% of the companies in the Russell 2000 index aren’t profitable. Add to that nervousness in regional banks and we can see why funds may be hesitant to allocate there with any size.

Systematic strategies have been adding to positioning aggressively since November of 2022.

We can see similar in hedge fund gross leverage, which has been on the rise since early 2023, as equity exposure rose.

On a net basis we can also see positioning is beginning to climb again at hedge funds, as they add long exposure.

Curiously, private clients are net sellers of equities over the last month. Are they the smart money here? Quite possibly.

With all of the back-and-forth in positioning and flows, we see that cumulative equity inflows have been relatively elevated for over a year. Suggesting that in aggregate, long positioning is still rather high. This is a concern as the American households still have near the highest percentage of their net worth allocated into stocks in history. Often markets only bottom after a larger de-risking.

The US service sector has been particularly resilient vs manufacturing, which is important as it represents over three quarters of US GDP. But it also demonstrates some factors that make inflation more potentially resilient. One of which is that within ISM services data we see price pass-through pressures continue to rise.

We also aren’t seeing signs of a meaningfully weaker labor market when netting out what appears to be a large amount of claims fraud from a single state, Massachusetts. When those claims are removed, we can see that the trend of jobless claims is actually falling again.
Good news for the economy, and American households, but bad news for the stickiness of services inflation as a driver of price pressures that companies are passing along has been rising wages.

US core CPI has been rising, with no signs of a meaningful slowdown. Sending the Fed a signal, that along with Friday’s hot PCE reading, inflation isn’t yet under control and remains resilient in the services sector.

There is cause for hope, though. We can see that NFIB corporate price plans data shows a lack of confidence in pricing power moving forward, suggesting that there may be some relief in sight.

The housing sector is showing some impressive resilience against a rather difficult backdrop, largely due to a lack of existing supply. Nevertheless, mortgage rates, and with them, new monthly mortgage payments, have surged significantly. Reducing the buying power of potential home owners who don’t have a lot of cash or equity.

Because of the shortage of existing homes on the market, new home sales continue to outperform. But with mortgage rates on the rise again, applications are falling.

In commercial real estate, the tightening of lending conditions we’re seeing is likely to make refinancing a challenge, and put pressure on office building prices in particular as vacancy rates are at record highs in many geographies.

With all of this known to the Fed, the central bank is expected by the CME FedWatch assessment of Fed Funds Futures to hike once more in June with a probability of 64.2%, or if not in July or August.

If the Fed does pause, one area of the market to watch based on historical trends is core bonds. The chart below shows the total returns for the Bloomberg Aggregate Bond Index over time, which, on average, has a 13% 1-year forward return from the time of the Fed pausing policy.

In closing, we have a market that is aggressively concentrated in a small number of stocks, lots of zombies in the Russell 2000, hedge fund participants that are largely increasing long exposure, inflation proving to be resilient so far but potential hope ahead, and growing concerns in key real estate markets.
This certainly sets us up for an interesting summer!