
Last week we saw a broadening of the rally, which is constructive. Breadth was significantly better than what we’ve seen of late. Though there was noteworthy weakness in insurance, some telecoms, agriculture, and a mixed picture in healthcare.
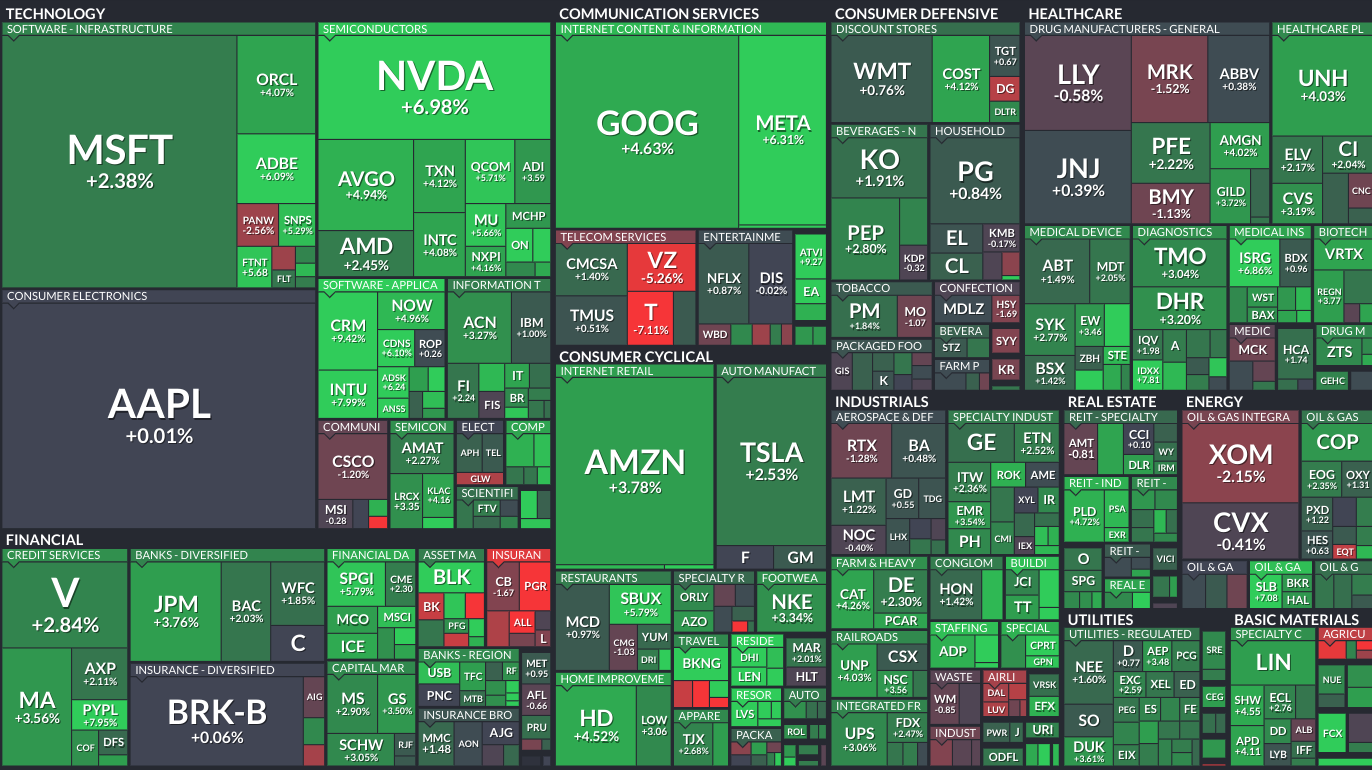
Economic data painted a picture of disinflation, which gave a bid to bonds and stocks, and had the dollar falling significantly.
Yesterday’s release of UoM Consumer Sentiment data surpassed expectations, with consumer sentiment surging 13% above its June level. This significant leap marks the most favorable reading since September 2021, a welcomed sight following a period of economic uncertainty.
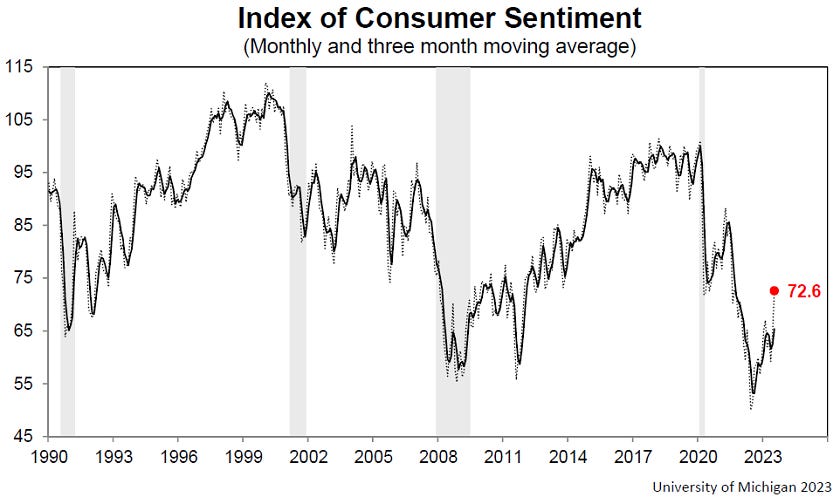
All components of the Consumer Sentiment Index showcased substantial improvements. The most noteworthy changes were a 19% surge in long-term business conditions and a 16% increase in short-run business conditions. This indicates growing optimism about the overall business environment, both in the near term and the long run.
Despite these improvements across the board, lower-income consumers didn't share the general positive sentiment, likely reflecting persistent disparities in economic opportunities and financial security.
Long-run inflation expectations remained at 3.1%, remaining at similar levels as we saw during June.
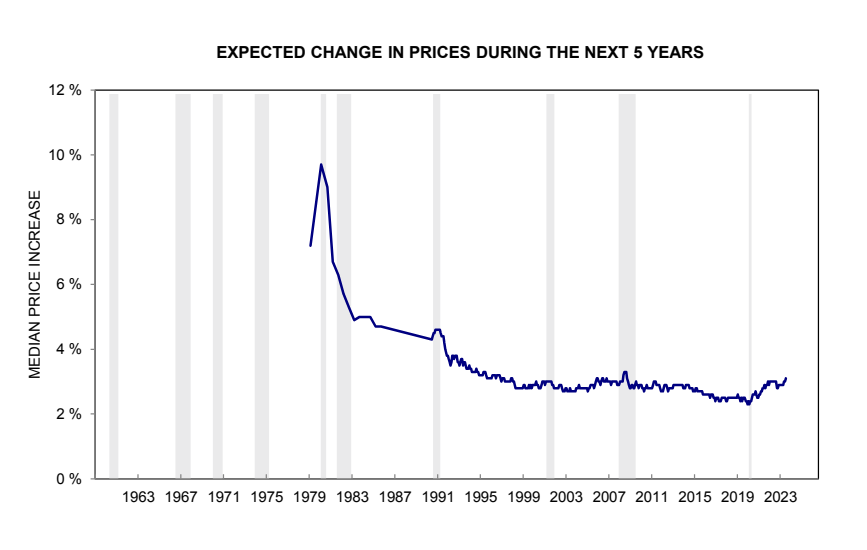
Speaking of inflation, the debasement of the dollar since the inception of the Federal Reserve has been rather pronounced, losing most of its purchasing power along the way for key goods and services, like housing, food, energy, medical care, education, and transportation.

We’ve just kicked off earnings season! Companies representing 80% of S&P 500 market capitalization will report their Q2 earnings by August 7th, according to Goldman Sachs.

Earnings downgrades are picking up pace as we kick-off earnings season, which suggests two things: analysts are less optimistic, and the bar is once again being lowered which could result in more “beats” vs expectations. We still feel quarter-over-quarter and year-over-year revenue and earnings trends are crucial to monitor for long-term investments.

Just seven megacap companies make up over 50% of the NASDAQ 100, which has prompted a mid-year re-weighting to ameliorate this concentration.

Speaking of high weightings, just 10 companies make up 31.7% of the S&P 500. Those same 10 contributed just 21.5% of earnings over the last 12 months, suggesting that there is a disconnect between earnings and equity performance. A theme that’s been rather persistent in 2023.

Uber has emerged from the COVID era much more diversified, growing their delivery and freight revenue significantly. The company is estimated to be GAAP profitable by Q3 earnings of this year.

US bankruptcies in the first six months of 2023 were the highest since 2010 among the companies covered by S&P Global Market Intelligence. While some may contend that this is a reversion to prior levels of bankruptcy filings, I think that the size of some of these bankruptcies are significant enough to warrant attention.

We see a similar trend in the UK, where company insolvencies have surged since COVID, only moderating slightly in Q1 of this year.

Speaking of undesirable events, peaks in 2-year note yields are often followed by risk-off events in the market. While we’ve yet to see a clear peak in 2-year note yields of yet, it is something to watch for as often the move lower is the market repricing what the Fed is most likely to do next.
In the case of 2-year note yields peaking and moving lower, that would suggest cuts are being priced in likely due to problems within the financial system and/or economy.

The global distribution of wealth heavily leans towards the west, and particularly the United States. Asia is emerging, however, and economies like that of India have significant potential over the decades to come.

Even now India is showing remarkable resilience compared to other global economies, with its services and manufacturing sectors continuing to expand at a healthy clip. Meanwhile, Europe resides on the bottom of this list as the regional economy slips.

Looking around the globe we also see another trend that sparks concern the potential structural resilience of services inflation: labor markets are historically tight in most countries.

Amazon Prime Day is a mass marketing extravaganza that earns the company a whole lot of money, but the question for consumers has become: are the deals real? Some have seen signs of items that were not actually marked down, but advertised as such.

The CBOE equity put-call ratio hit 0.39 on Tuesday, the lowest level since November of 2021. This suggests that speculative flows are becoming rather euphoric in single stock options.

Goldman Sachs expects earnings growth in the second quarter at -9%. We’re still looking at the fourth quarter with a deeper trough of about -16% before the “earnings bottom” is in. But we remain open to reviewing the data as it comes out and revising our view as is warranted.

Commercial mortgage-backed securities spreads remain rather elevated, and stress is building as we see growth in delinquencies, defaults, and bankruptcies. Particularly within office buildings and retail. Those commercial property prices are, in aggregate, in decline.
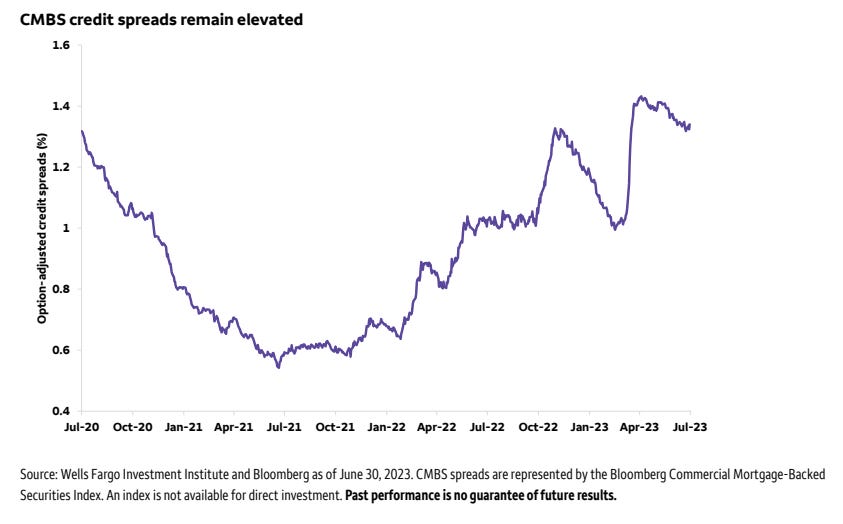
Residential real estate paints an altogether picture, however, as the upward pressure in housing prices is expected to continue, which may put a floor on how low inflation can go as shelter is the highest weighting in CPI.

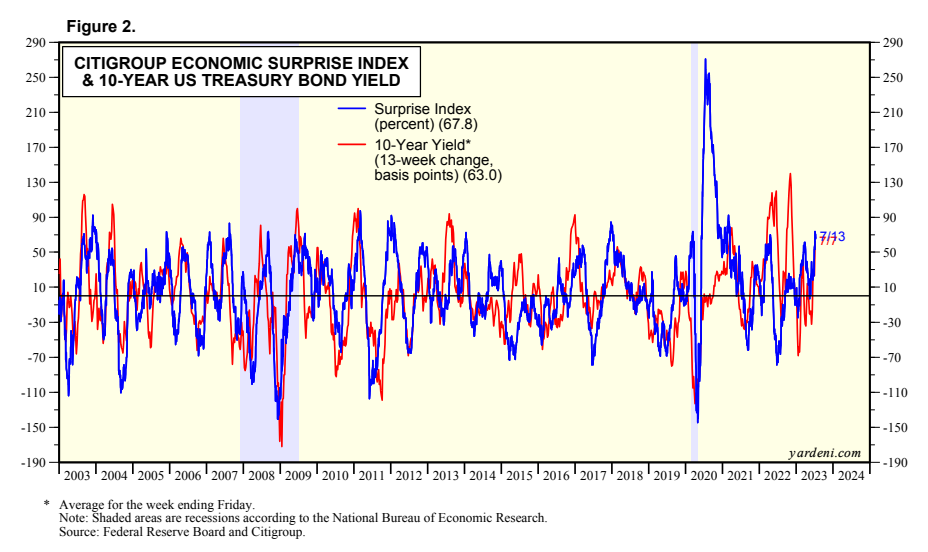
Positive surprises in economic data go beyond housing, with ISM services showing renewed strength and the labor market remaining relatively resilient, with real wages beginning to rise. These economic surprises suggest that yields on the 10-year note may have farther to rise.
One reason for the economic resilience we’ve seen is a backlog of COVID-era projects combined with the Biden administration’s Inflation Reduction Act and CHIPS Act, which has boosted domestic investment.

While core goods, and to a lesser extent services excluding housing, are making progress within PCE, housing is only recently moderating, and remains at an annual rate of increase over 8%.
Core PCE also remains resilient, at 4.62%. A level that would certainly give the Fed some degree of consternation regarding the progress made after such an aggressive rate hiking cycle.

Goldman Sachs shows a continuation of a theme that we've been discussing for some time: the Great Rotation.
Out of equities and into bonds and cash with a 5% yield. Equity risk premium vs bills is the lowest in over two decades, making fixed income a much more attractive allocation.

Equity positioning remains elevated, but is not yet at an extreme based on this measure by Deutsche Bank.

Energy seems to be quite underowned across a number of different views of allocation concentrations. We remain constructive on XLE in the short-term, but if the economy does begin to slow more meaningfully, both here and abroad, oil prices are likely to slip and energy stocks could as well.

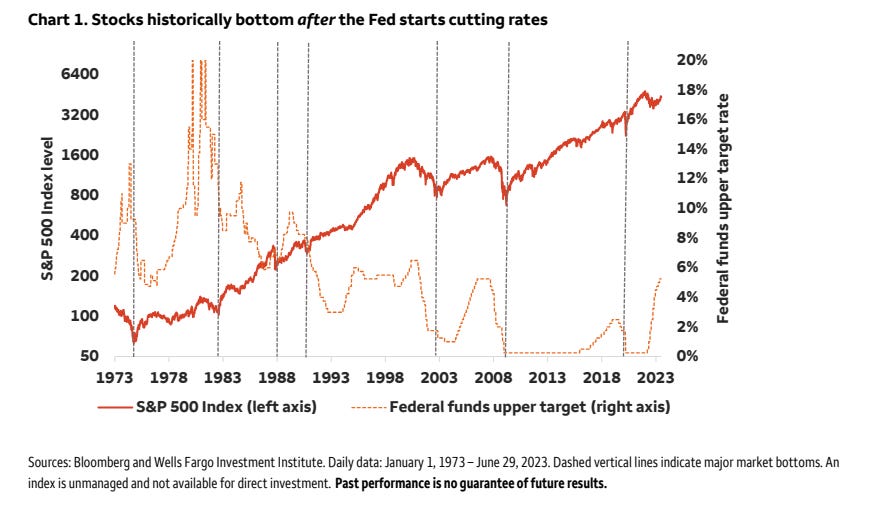
According to this data compiled by Bloomberg and Wells Fargo, stocks historically bottom after the Fed starts cutting rates. Typically about 10 months later.
While the index-level returns for the market cap-weighted S&P 500 have been impressive year-to-date, the majority of those returns were driven by a handful of large caps.
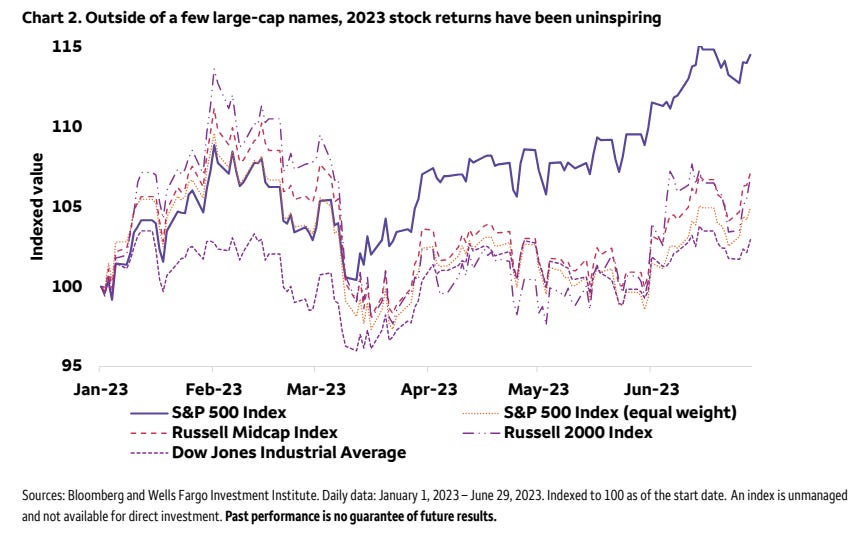
Returns elsewhere remain muted. The question is whether the rest of the market catches up or the large caps catch down. Perhaps earnings will provide some color.
Unwinding short trades in the JPY, has led to strength in the Yen. It's been the best performing currency over the last one week breaking the key level of USD-JPY at 140.
The US Dollar on the hand has been pulling back significantly.

China's GDP has risen quickly for many years, but that growth rate is likely to slow materially as their real estate and construction sectors languish and export demand remains muted.

A close examination of China’s CPI shows increasing signs of downward economic pressure as the re-opening continues to show signs of weakness. Total CPI was flat month-over-month, with goods falling 0.5%. Services rose 0.7% and core was up 0.4%

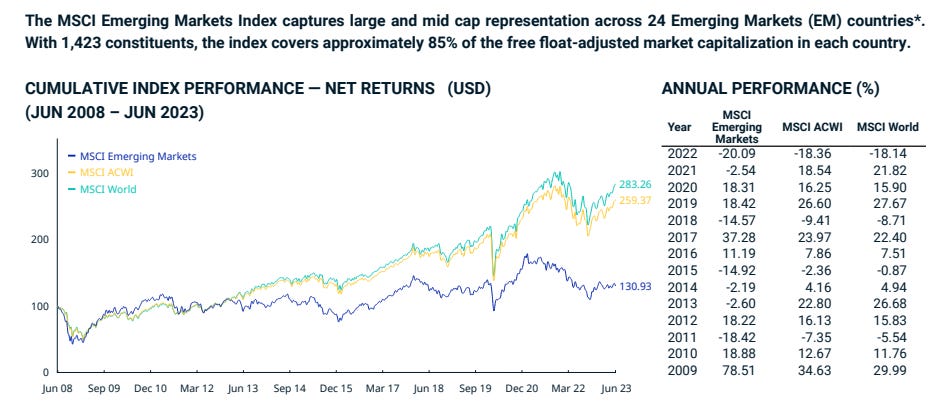
In closing, we continue to contend with a push-and-pull dynamic within the global economy, whereas the west and China are slowing, but we see resilience in certain emerging markets, such as India, Mexico, Brazil, and Chile.
It may be important to watch the EM space as we navigate throughout the year and into next as it often leads when a new bull market emerges.
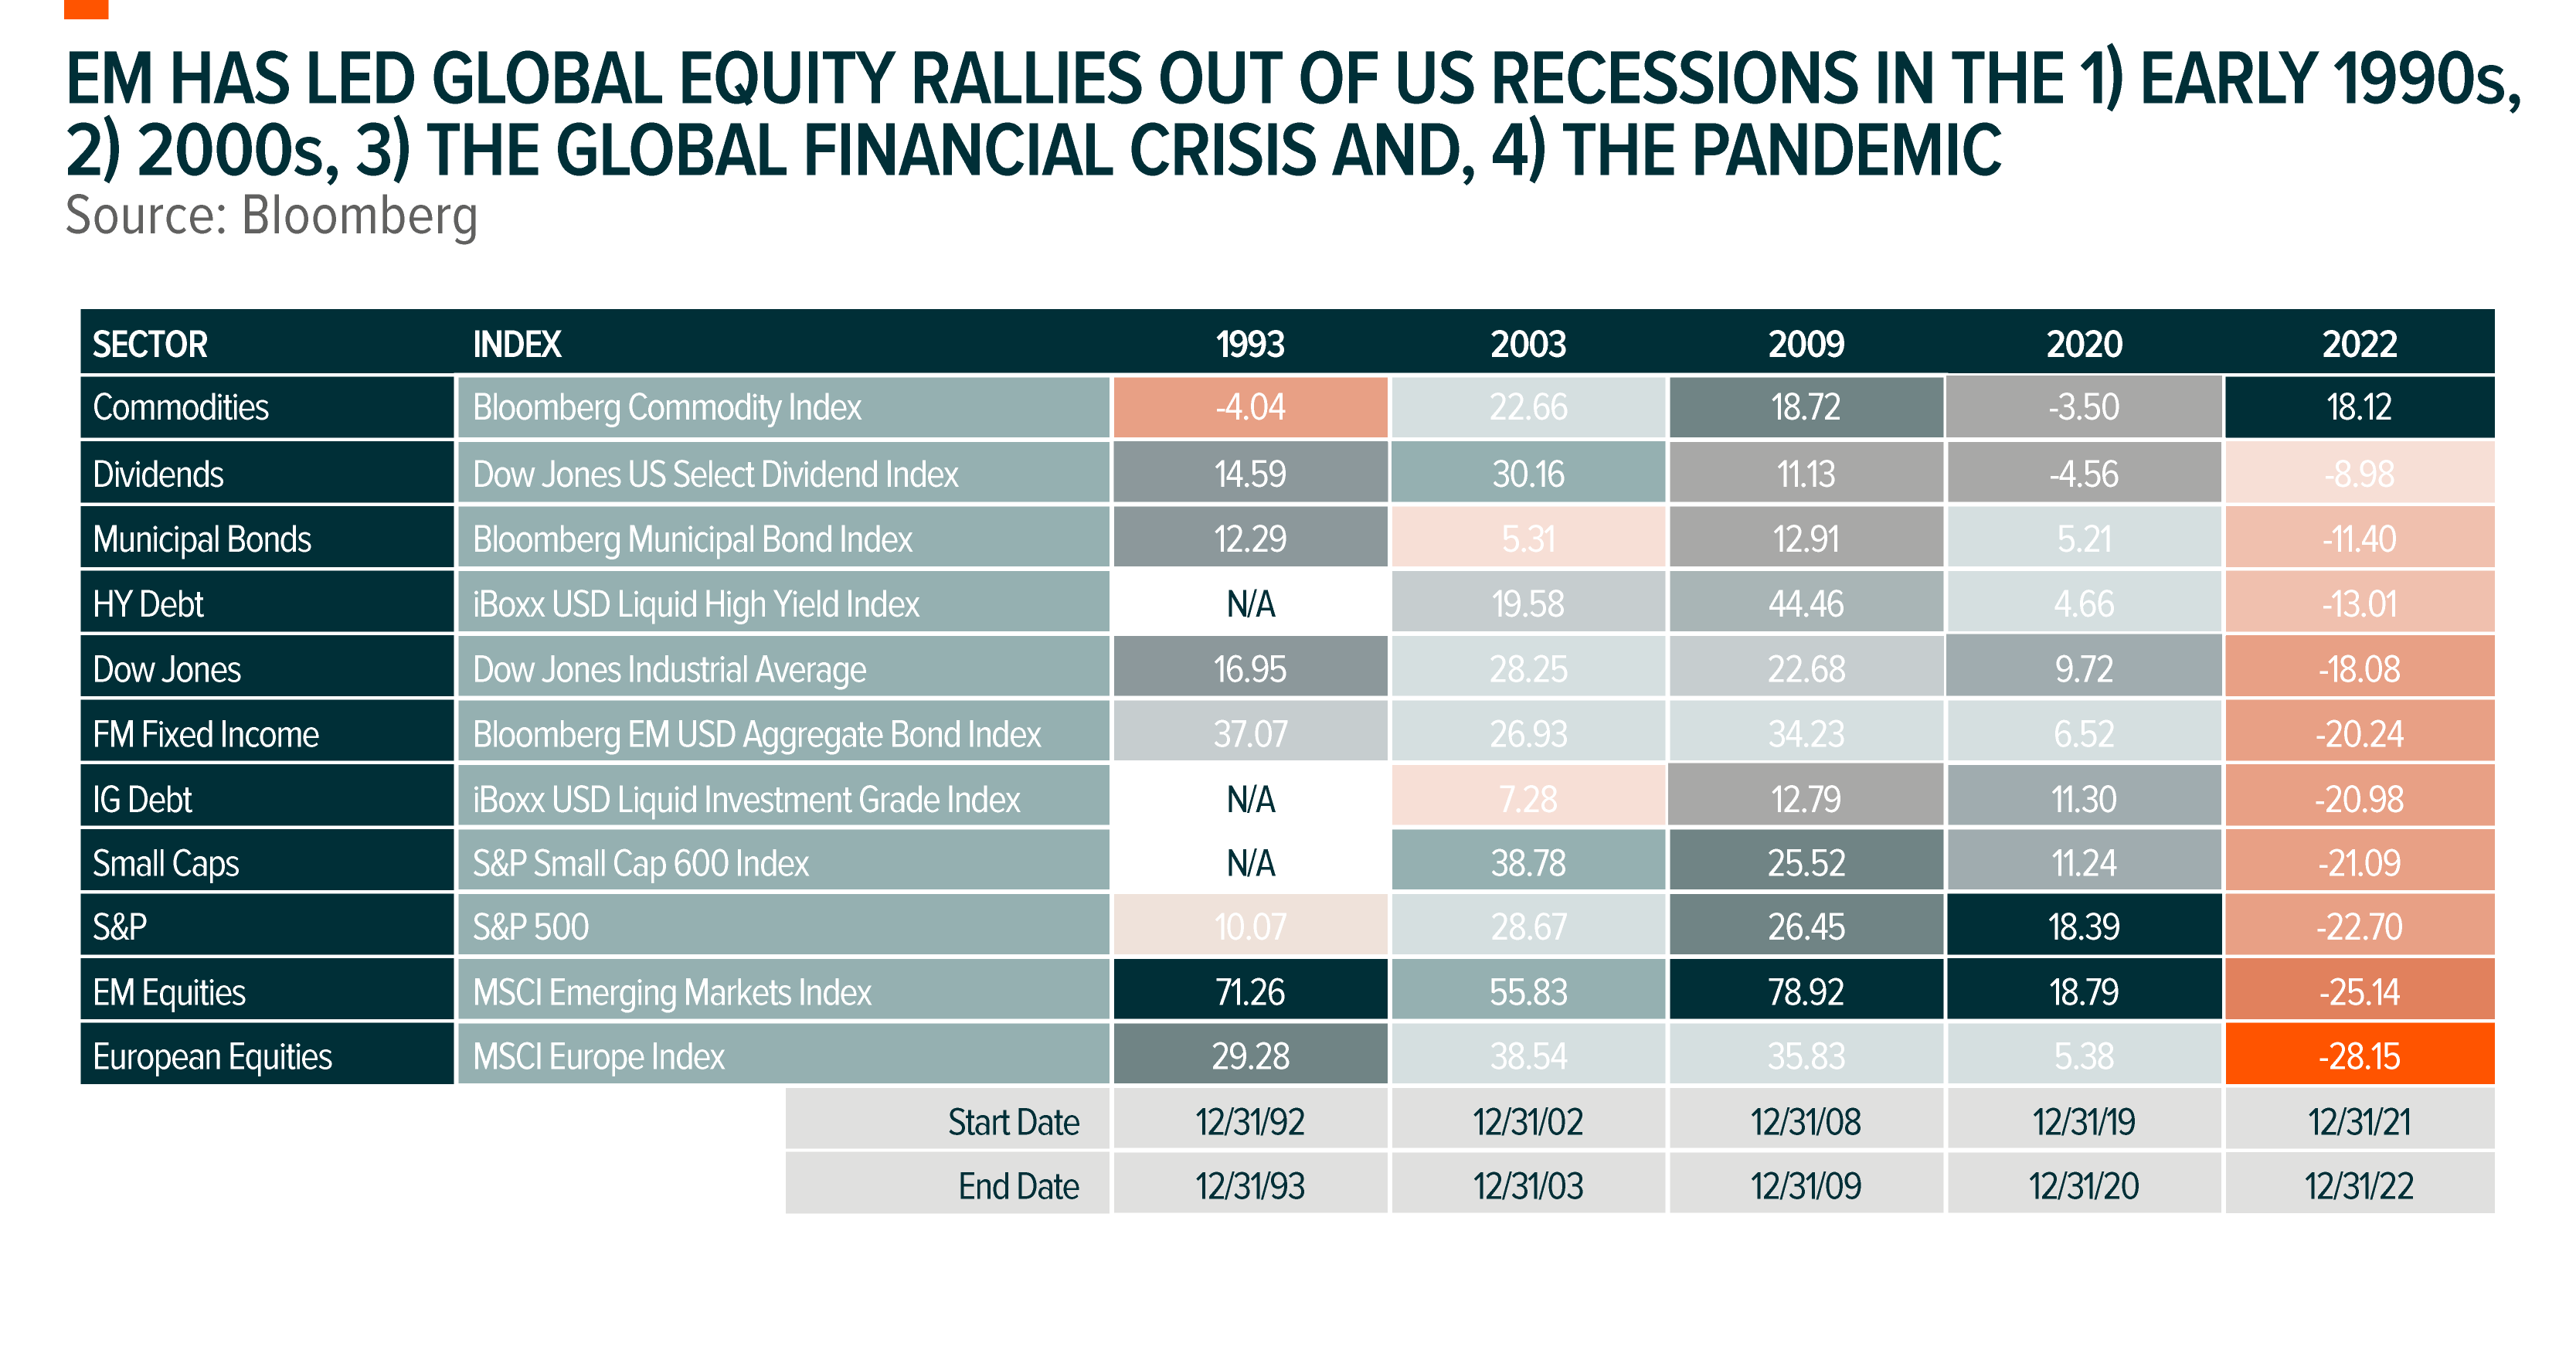
We certainly have not seen that performance of yet, as much of the YTD performance has been from the US, EU, and Japanese markets.
As always, I hope you enjoyed this edition of Charts of the Week. If you have any questions or feedback please leave them in the comments below.
Love the broad swath of data on this one, Mayhem. ‘Mount Higherest for Longerest’ indeed. I really like Uber as well - and was glad to see the broadening of their business in that chart. Though I am reluctant to buy the stock at these prices. Waiting for now. 👍