
What a week it’s been! Markets had the worst drawdown since the SVB banking crisis, with the S&P 500 falling 1.47%, NASDAQ falling 1.41% and Russell 2000 leading the way lower down 3.03%.
We have a lot of charts to go through this week, so let’s dive right in!
The $1.4T commercial real estate debt maturity wall is likely to become an issue in the back half of 2023 and through 2024. Banks own half of this debt, and regional banks own 75% of the bank's share of it.

AI mania continues, but we feel that the hype has vastly exceeded the near-term capabilities and the resulting multiple expansion is not warranted unless we start to see meaningful margin expansion in Q2 earnings (which is unlikely).

AI-related stocks account for most of the gains in the S&P 500 year-to-date.

QQQ vs TLT: Jaws remain wide open

A broader view of this relationship over the years as seen by the US 10-year real yield vs S&P 500 IT index

NASDAQ valuations have surged at the third fastest pace in the last two decades! Will tech stocks grow into these lofty multiples or will we see a re-rating of risk?

According to JP Morgan, the markets are feeling quite squeeze happy of late. But the bank cautions that this episodic squeezing of highly shorted stocks may not be sustainable, having recently reached an extreme.

S&P 500 performance vs global central bank liquidity.

The largest seven stocks make up a whopping 28.2% of the S&P 500's weighting.

“For the first time ever the yield on cash, bonds and equities is the same,” said Luca Paolini, chief strategist at Pictet Asset Management. “If you are a US investor you should probably buy bonds because in risk-adjusted terms they give you more.”

The Leading Economic Index is flashing red for the 14th month in a row
It's being weighed down by:
- Manufacturing
- Consumer expectations
- Average Weekly Hours
- The Yield Curve (based on 10s - FFR)

Banks are lending less, and in a debt-driven economy that could slow down growth.

Taiwan's exports have been falling for 9 months
A warning sign for global growth. The country's top two exports are:
1) Electrical machinery, equipment: US$245.8 billion (51.4% of total exports)
2) Machinery including computers: $62.9 billion (13.2%)

The reopening that wasn't: China's economy slowed in May.

It's as if the Fed never hiked at all ...

Money market fund assets are nearing an all-time high.

Is this a new bull market or a head fake? Credit Suisse data shows that while most of the time a meaningful break above the MA(200) starts a new bull, there have been two occasions since 1966 that proved to be an exception: May of 1982 and March of 2002.

Mega cap stocks are in the "sell zone"
The significant outperformance of the broader S&P 500 YTD suggests that we may be due for some degree of cooling off in this ratio. We believe this could be an opportunity to raise cash or add hedges It also may setup a long S&P 500 equal weight vs short mega cap basket pair trade.

S&P 500 drawdowns are often sharper 3+ months after periods of narrowing breadth.

A tale of divergent risk appetites as the S&P 500 broadly outperforms junk bonds.

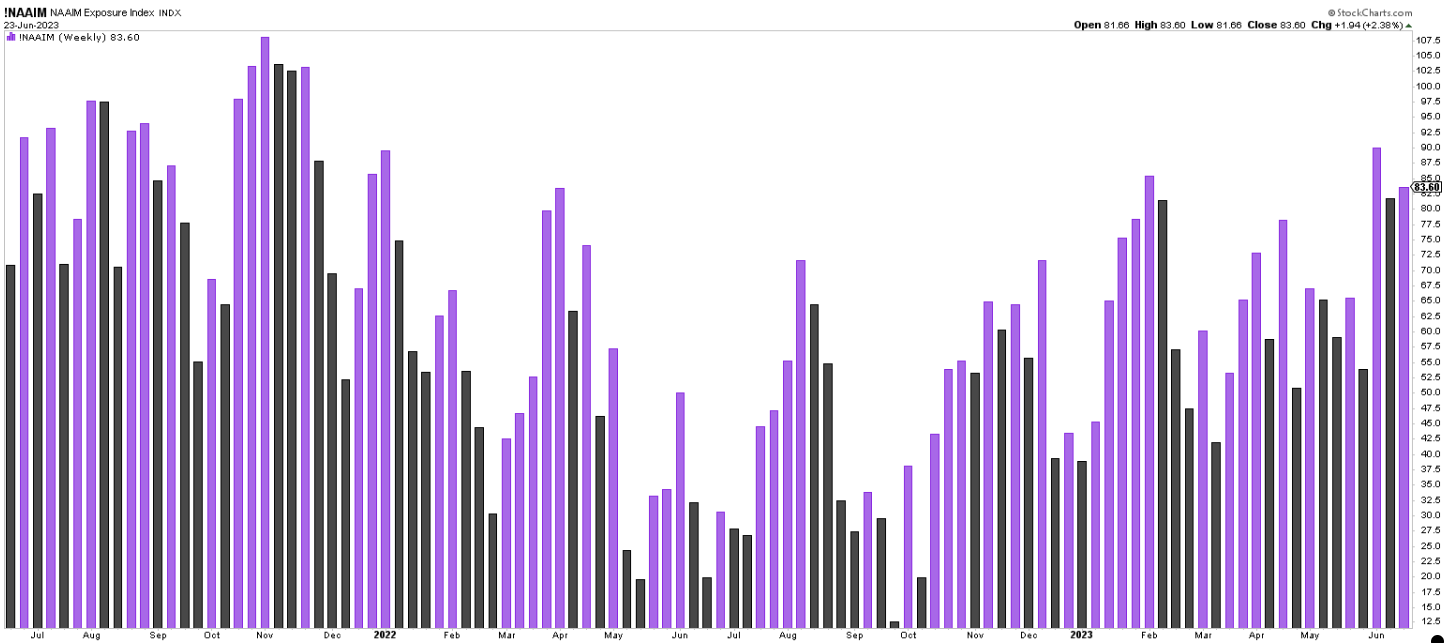
Managed money remains very long, via the NAAIM survey
This is a sign, along with stretched positioning from hedge funds, CTAs, and retail, that the market may need a bit of a corrective period to work off recent frothy sentiment and valuations.
China's credit demand is falling as the economic outlook sours.

China's easing has led to a sizable drop in 10-year government bond yields, but their equity markets have given back much of their YTD gains. Problems remain in the country's real estate and construction industries, which are the most important to its economic growth.

The difference between global services and manufacturing is quite significant.

Tech exports are showing 'tentative signs of stabilization' according to NAB.

Passive flows are adding to concentration risk in the already largest companies in these market cap-weighted indices.

Visualizing "the Great Rotation" as we see outflows from equities and into bonds + cash.

Institutional clients of BofA are buying communications services and selling technology. They are net buyers of equity exposure.

We're seeing healthy inflows into healthcare recently, which we believe is a defensively positioned component of the market where there may yet be upside.

Energy flows have flipped negative recently, per BofA data. With the volatility in the energy sector recently we can see why there would be room for caution But energy as a sector remains attractively valued vs many other parts of the market.

We see hedge funds and institutions adding to positions while private clients are reducing risk at BofA.

Morgan Stanley did the math on the liquidity drain to fund the Treasury General Account. According to them, at least $500B will be funded by bank reserves. That's a decent amount to cause stress on liquidity.

According to PitchBook, 2023 is on track to be the third worst year ever for leveraged loans, with the worst ever being 2009, and the second worst 2020. Our outlook is that a credit crunch is going to intensify over the second half of this year and into 2024.

S&P 500 company valuations are quite stretched.

US Sector Valuations: tech is quite expensive as a whole.

The mega caps are objectively expensive here, too.

Here's an interesting chart on the divergence between ISM Manufacturing PMI and the SPX YoY price change.

Here's a chart from Morgan Stanley's latest note by Mike Wilson and team. They like to track Global Liquidity vs. the $SPX.
No doubt you've seen Mayhem post the charts of Central Bank liquidity and the SPX. Here's another version of that showing Global M2 money supply and SPX.
The conclusion is that either Global M2 catches up to the S&P or the Index catches down to M2. According to MS, given that they think earnings still have room for a decline, they see the SPX catching down.

While the overall NFIB Small Business Optimism Index came out slightly higher, the percentage of firms expecting the economy to improve declined. At this stage, a recession is all but expected.

We're seeing a rather significant rise in month-over-month housing starts

Fed Funds Futures continue to price in an earlier series of rate cuts than what the Fed is guiding for The question is does the market believe in immaculate disinflation or does it feel there's a more meaningful credit crunch coming that will necessitate a Fed response?

After July we see CPI year-over-year comps become more difficult As a result, we may begin to see the headline number rise again if inflation remains sticky

We hope that you enjoyed this Charts of the Week!