

Happy Friday! As we wind down the week there’s a lot of ground to cover in this edition of Charts of the Week.
We saw the largest volume in IWM calls ever recently, and a day after that the surge in small caps continued, only to be unwound on Thursday and today.

We also recently saw the largest call volume in SPX ever, as 0DTE options traders have become meaningful market participants, accounting for nearly half of all SPX options trading volume.

The CBOE put/call ratio also ended the week last week at the lowest level we had seen since early March of 2020. What followed was about an 800 decline in the S&P 500. That doesn’t mean that past is prologue, but it is certainly interesting to be aware of what had happened.

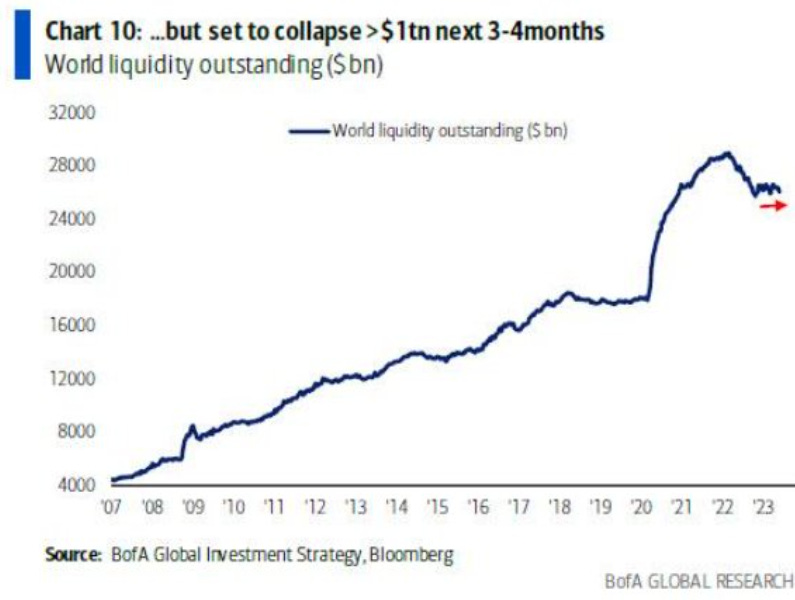
According to Bank of America, global liquidity has been ample over 2023. We’ve certainly seen markets rejoice as balance sheets of the Bank of Japan, Bank of China, and even the Fed have expanded.

But as we see a large amount of US Treasury issuance and other factors, such as tightening credit conditions, we’re likely to also see liquidity fall by about $1 trillion, according to BofA.
Tech saw the largest monthly inflows during May since February of 2021, another area worth reflecting on as that was around the time we saw a lot of smaller cap names peak, and market breadth began to narrow further and further throughout 2021.
This time there isn’t much room for breadth to narrow further, but we are seeing this sort of an extreme which I think deserves a cautious reading.

Particularly because last week we also saw the largest inflow in to tech stocks ever, on top of one of the largest monthly outflows.

We can see that the year-to-date returns have been somewhat constrained. If we look at the “magnificent 7” of META, AMZN, AAPL, MSFT, GOOGL, TSLA, and NVDA, then the return on that basket is 54% year-to-date!
But the broader market only returned 12% in comparison, and if we net out those companies, the remaining 493 S&P 500 components would only return a paltry 2%.

2023 has been the third best year ever for buy-the-dip strategies. 2021 was the best year on record.
2022 was not a good year for this strategy.

Next week we have $296B of Treasury issuance coming in, which is significant and may begin to have a drag impact on market liquidity dynamics, causing some tail risk to increase for stocks and bonds.

The National Association of Active Investment Managers (NAAIM) survey rose to over 90, which is the highest level we’ve seen since early 2022. Any level of 90 or more is, in our view, a bit exhaustive.
That is to say, buyers may not have a lot more ammunition left given that CTAs are very long, NAAIM survey participants are very long, and we’re seeing record inflows into various concentrated areas of the market, like tech.

On a positive note with regards to inflation, global supply-chain pressures are continuing to ease. In fact, they’ve eased to levels that we haven’t seen since the Great Financial Crisis.
That’s a bit of a concern from an economic perspective as it suggests, along with export data from China, Korea, Taiwan, and elsewhere, that we’re seeing a very sluggish global economy.

Which leads us to the next slide. The Deutsche Bank recession probability indicator has risen to near 100% over the next 12 months, meaning that the indicator says there’s near certainty that sometime over the next year we will be in a recession.

The growing divergence between margin debt and the NASDAQ 100 suggests that much of the upward momentum is driven more by options-driven leverage.

When ISM services rolls over, we believe US non-farm payrolls will follow And from there we see the likelihood of an imminent recession rise meaningfully. Until then, however, services-related inflation remains a concern for the Fed.

The Bank of America global EPS model remains negative, suggesting that we've yet to see the trough in this earnings recession.

Healthcare has had the worst performance relative to the S&P 500 in over 30 years. We believe this may present an opportunity. We will discuss this further soon.

Hedge funds have the lowest net exposure to financials in about three years.
That low positioning may mean we see some opportunities within the space, particularly within the stronger companies that have been unfairly beaten down

While short positioning has risen somewhat in May, net positioning remains quite long in US tech from hedge funds via Goldman Sachs data.

Technology flows are the largest of any sector, by quite a lot. This aggressive allocation into early cycle names during what we believe is an end cycle environment may provide opportunities to raise cash and enter shorts should momentum shift lower.

Flows into US technology funds surged recently, driving share prices higher. Particularly within the largest tech firms. We believe that in the short to intermediate term the returns in tech may be subdued, with risks to the downside growing from concentrated positioning.

We can see that there's been what we could reasonably refer to as panicked call buying in mega cap growth and tech stocks. This is often a sign that speculators are becoming extremely bullish, and may lead us toward exhaustion.

NYSE FANG vs NASDAQ equal weight performance is the most extreme that it's ever been, illustrating the narrow leadership in this market

The NASDAQ 100 is setting new records for the most bullish net positioning in its futures contracts.
This shows how stretched positive sentiment and long positioning has become in big tech.

Risk appetite for low volatility stocks is still rather pronounced, but we are curiously observing a rising appetite for cyclicals vs defensives at the same time.
To see both a late cycle and mid cycle allocation theme playing out simultaneously speaks to relative confusion among asset managers.

Institutions are buyers are retails are sellers. We can see it in US equity sentiment among commercial players.

This is theme that suggests that households may be beginning to raise cash as economic conditions become less favorable. Further illustrating that point, the IBD/TIPP Economic Optimism survey also came in much lower than expected.

Thank you for reading this week’s special edition of Charts of the Week! We hope that you enjoyed the addition of this new premium content.
Thank you for the reply. Appreciate it!
What’s the difference between macrovisor and traderade membership?